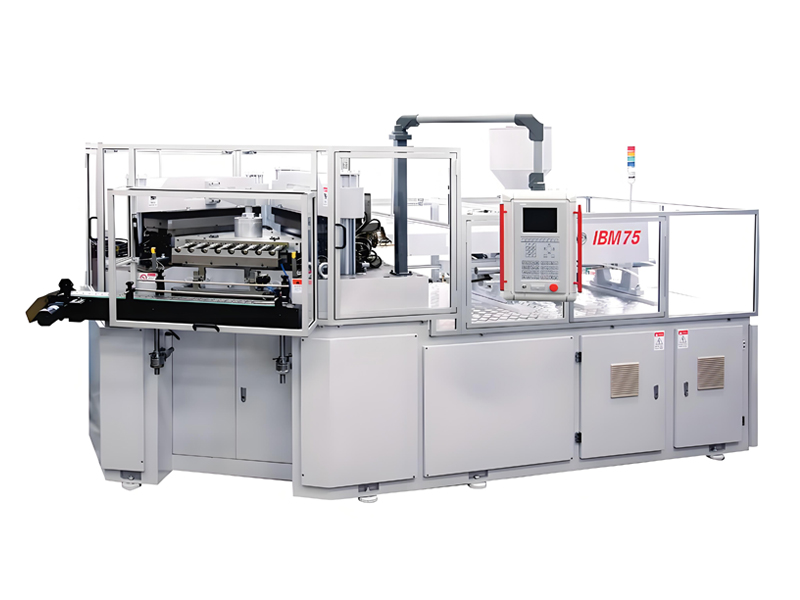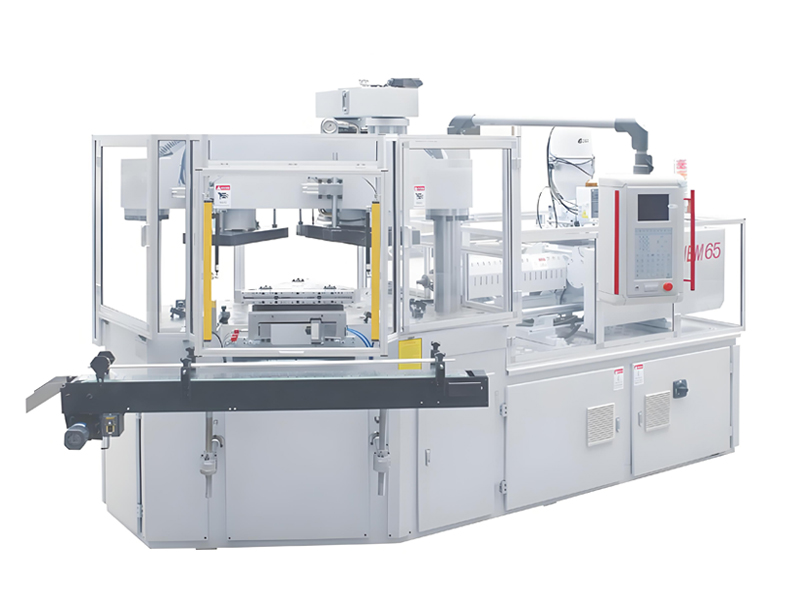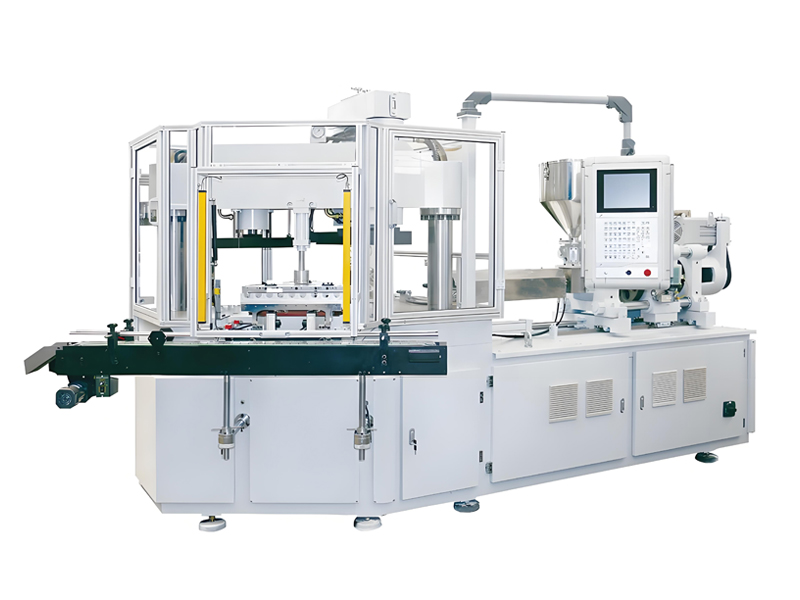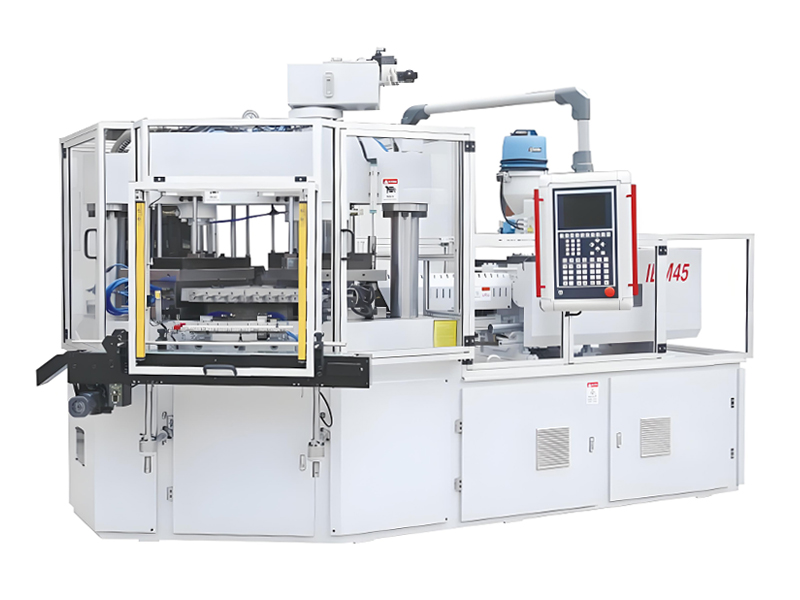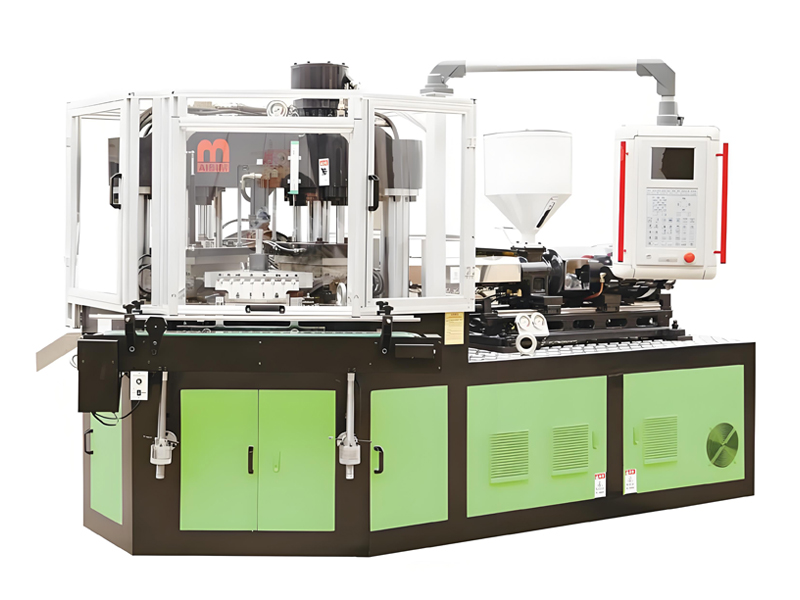
Running an injection blow molding machine looks simple from the outside: resin in, bottles out, repeat. The annual operating cost, however, is shaped by a handful of recurring inputs that quietly decide whether a plant stays profitable. For a new or expanding bottle maker, the smartest financial move is not to chase the lowest headline machine price but to understand the yearly load of raw material, energy, labor, and maintenance that the line will demand. This article breaks down the operating cost of an injection blow molding line into measurable components and expresses each one as a relatable cost level rather than a hard number, because material grade, local power tariff, shift pattern, and product weight change the absolute figure plant by plant. Aibim, a Wanplas factory, builds three-station IBM machines in the IBM75, IBM65, and IBM55 Hybrid ranges, and the guidance below reflects how those machines behave in real production of pharma, food, drink, and cosmetic containers from 3 ml up to 1000 ml. Whether you already run an IBM line or are comparing it with extrusion blow molding, the framework here lets you build a credible yearly cost picture using percentages, energy intensity, headcount, and maintenance intervals instead of guessing a single figure.
فهم التكلفة التشغيلية السنوية الحقيقية لخط IBM
The annual operating cost of an injection blow molding line is the sum of everything you spend to keep it producing bottles for twelve months, excluding the original equipment purchase. It is useful to separate the cost into four layers: material, energy, labor, and maintenance. Material is the plastic resin that becomes the bottle plus the small fraction lost as scrap. الطاقة is the electricity that drives the hydraulic system, barrel heaters, mold temperature control, and the compressed air used for blowing and part ejection. العمالة is the shift crew that loads resin, monitors the line, samples quality, and packs finished goods. Maintenance is the planned servicing plus the replacement of wear parts and the risk cost of unplanned stops. Each layer scales differently, and that difference is the key to managing the total.
Material cost scales almost linearly with output volume and product weight. الطاقة scales with operating hours and machine efficiency. العمالة scales with shift count rather than machine count, which is why a second or third shift does not triple the crew. Maintenance scales with both runtime and the age of the tooling. When you plan a year of production, the dominant lever is almost always material discipline, followed by energy efficiency, then labor productivity, then maintenance discipline. A plant that trims its scrap ratio by a few points often saves more across a year than the same plant would save by negotiating a small discount on spare parts. That ordering should guide where you invest management attention.
A practical way to model the year is to fix a production target in bottles per year, then convert that to kilograms of resin, operating hours, shift crews, and maintenance events. The table below shows the relative weight of each layer for a representative single-line IBM plant running two shifts on small pharma and cosmetic containers. The levels are expressed as Low, Medium, High, and Very High so the picture holds for different regions and resin grades.
طبقات التكلفة التشغيلية السنوية النسبية لخط IBM واحد
| Cost Layer | Primary Driver | Scales With | Relative Annual Level |
|---|---|---|---|
| Raw material (resin) | Bottle weight and scrap ratio | Output volume (kg) | Very High |
| الطاقة (electricity + air) | Machine efficiency, running hours | Operating hours | Medium |
| العمالة (shift crew) | Shift count, automation | Shift count | Medium |
| Maintenance (planned + wear) | Runtime, tooling age | Runtime and cycles | Low to Medium |
| Unplanned downtime (risk) | Failure, slow response | Reliability discipline | Low to Very High |
الخلاصة بسيطة: المادة هي حيث تتدفق الأموال، والطاقة والعمالة ثابتتان، والصيانة هي الطبقة التي تتحكم فيها لتجنب قفزة مرتفعة جدًا من التوقف. تحدد الأقسام أدناه كمية كل طبقة بالمقاييس المهمة فعليًا في أرضية المصنع.
استهلاك المواد الخام ونسبة فقدان الفلاش
الحقن blow molding is valued because it is a one-step, three-station process that produces a finished container with a molded neck and, in most cases, essentially no flash. That structural advantage directly lowers the material portion of annual operating cost compared with processes that generate a parison scrap or a trimming tail. Still, material is the largest recurring input, so the scrap ratio is the single most important number to manage across the year. The scrap ratio is the mass of non-sellable plastic divided by the total resin throughput. It includes start-up purge, short shots, deformed bottles, color-change losses, and regrind that cannot be reused for food or pharma contact.
For a well-run IBM line making standard HDPE, PP, or PS containers, the steady-state scrap ratio can sit in a low band when the process is stable and the mold is in good condition. The ratio rises during product changeovers, color changes, and the first hours after a mold swap. A disciplined plant keeps a separate log of start-up scrap versus running scrap, because the two behave differently: running scrap is a process-quality problem, while start-up scrap is a changeover-efficiency problem that improves with faster, cleaner mold changes and pre-heated tooling.
Resin choice also moves the material level. Clear PS و SAN grades for cosmetic and pharma viewing are typically at a higher material level than commodity HDPE, while recycled-content or filled grades can sit at a lower level but demand tighter process control. The table below ranks common IBM materials by typical annual material intensity and regrind friendliness. Note that for food and pharma contact, regrind reuse is often restricted, so the effective scrap level is higher for those applications than for industrial or cosmetic grades where closed-loop regrind is permitted.
كثافة المادة وسلوك الهدر حسب الراتنج
| Resin | Typical Use | Material Level | Regrind Reuse | Scrap Control |
|---|---|---|---|---|
| HDPE / LDPE | Pharma, food, cosmetic | Low to Medium | Limited for contact | Low scrap band |
| PP | الغذاء, drink, medical | Low to Medium | Limited for contact | Low scrap band |
| PS / SAN | مستحضرات التجميل, pharma view | Medium | Restricted | Medium scrap band |
| PC / PCTG | Premium cosmetic, medical | High | Restricted | Medium scrap band |
| ABS / TPU | Technical, specialty | Medium to High | Case by case | Medium scrap band |
When you convert the year into resin mass, use the finished bottle weight plus the scrap allowance. A plant making small 10 ml to 30 ml cosmetic bottles might run a low per-bottle weight but a higher relative scrap share because the neck and gate detail are unforgiving. A plant making 500 ml to 1000 ml containers carries a much larger per-bottle mass, so the material level is High even if the scrap ratio is excellent. The annual number that matters is total kilograms through the throat, not just the bottles shipped.
استهلاك الطاقة: الكهرباء والهواء المضغوط
الطاقة is the Medium layer of annual operating cost, but it is the one most influenced by the machine design you choose. A three-station IBM machine has three loads: the hydraulic or electric clamp and injection unit, the barrel and nozzle heaters that keep resin molten, and the compressed air that forms and ejects the bottle. The combined energy intensity is often expressed in kilowatt-hours per kilogram of finished product, which is a fair cross-plant comparison metric because it removes bottle size from the equation. Across the IBM category, the typical band is moderate, with the lower end occupied by machines using PREFILL hydraulic technology and variable-displacement pumps, and the higher end occupied by fixed-volume pump designs that idle with constant motor load.
Aibim machines apply PREFILL technology and variable-displacement pump pressurizing in the hydraulic system, and the brand quotes a minimum energy saving of thirty-five percent versus conventional constant-load designs. In a two-shift or three-shift plant, that saving repeats for every operating hour, so the yearly energy level for an IBM75 or IBM65 with this hydraulic architecture lands in the lower part of the Medium band. The IBM55 Hybrid, with an electric assist on selected motions, pushes the energy level further down, which is why hybrid machines are attractive for plants with long annual run hours and higher local power rates.
Compressed air deserves its own line in the energy budget. IBM blowing uses clean, oil-free air at a moderate pressure, and the air compressor is a separate auxiliary load that is easy to forget when people quote only the machine nameplate. A leaking blow needle or an oversized compressor running unloaded can push the air portion from Low to Medium. The table below maps the energy components to a relatable level and gives the kind of engineering metric a plant should record each month.
مكونات الطاقة ومقاييس التتبع الشهرية
| الطاقة Component | Level (typical IBM) | Metric to Track | Optimization Lever |
|---|---|---|---|
| Hydraulic / electric drive | Medium (Low with PREFILL) | kWh per kg product | Variable pump, servo axes |
| Barrel and nozzle heating | Medium | kWh per operating hour | Insulated nozzles, setpoint control |
| Mold temperature control | Low to Medium | Chiller load kWh | Right-sized chiller, setpoint |
| Compressed air (blow + eject) | Low to Medium | Air leak rate, duty cycle | Leak repair, load-matched compressor |
| Auxiliary (conveyor, dryer) | Low | Ancillary kWh | Right-sized, sequenced start |
To build a yearly energy figure, record the line meter reading at the start and end of each month, divide by the kilograms produced, and watch the kWh-per-kg trend. A rising trend almost always points to a heater band degrading, a hydraulic leak, an air leak, or a chiller struggling. Because energy is a Medium layer, the absolute annual saving from a five percent efficiency gain is smaller than the saving from a five-point scrap reduction, but it is far more reliable and compounds every hour the line runs. For a plant planning three shifts, the hybrid IBM55 becomes a sensible default because the energy level stays Low across very high annual run hours.
دورات صيانة القالب واستبدال المواد الاستهلاكية
The mold is the heart of an IBM line and the part most exposed to wear. The three-station process means the same cavity set injects the parison, transfers it, and blows it, so the neck rings, blow needles, stripper inserts, and core pins see continuous thermal and mechanical stress. A clear maintenance rhythm keeps the annual maintenance layer in the Low to Medium band instead of letting it spike. The rhythm has two parts: routine care performed by the operator and scheduled replacement of consumables performed by the tooling technician.
Routine care includes daily cleaning of the parting line, weekly inspection of neck inserts for gate buildup, and monthly check of venting and cooling channels. Scheduled replacement covers the items that wear on a predictable clock: nozzle tips and heaters, blow needles and seals, stripper and transfer inserts, and the sensors that confirm parison pick and bottle eject. The replacement interval depends on resin abrasiveness, cycle count, and cooling water quality. A plant running filled or recycled-content resin will replace wear items more often than one running virgin PS or HDPE. The table below gives a practical replacement clock expressed in operating months and a relatable cost level for the combined annual reserve.
جدول استبدال الأجزاء المتآكلة والمستوى السنوي
| Component | Typical Interval | Why It Wears | Annual Level |
|---|---|---|---|
| Nozzle tips and heaters | 6 to 12 months | Thermal cycling, degradation | Low |
| Blow needles and seals | 3 to 9 months | Air erosion, seating wear | Low to Medium |
| Neck and stripper inserts | 9 to 18 months | Gate and eject stress | Medium |
| Core pins and cavities | 18 to 36 months | Abrasion, corrosion | Medium |
| Sensors and switches | 12 to 24 months | Contamination, fatigue | Low |
Aibim’s own CNC center produces machine parts and mold components in-house, which shortens the lead time for replacement inserts and keeps the annual maintenance level predictable for customers. The Wanplas brand shared policy also includes a complimentary annual spare-parts allowance for its factory lines, so the effective yearly maintenance reserve can be planned at the Low end when the plant keeps a small stock of the highest-wear items on site. The mistake most new operators make is to treat maintenance as an event rather than a rhythm: they wait for a failure, then pay the Very High price of downtime plus urgent freight. Spreading the same spend across the year as planned replacement keeps the layer Medium and the line available.
تكوين العمالة وتوزيع الورديات
العمالة is the second Medium layer, and it behaves differently from material and energy because it scales with shift count rather than with machine count. A single IBM line running automatically needs only a small crew per shift: one operator who supervises the machine, monitors quality, and handles minor faults; a part-time material handler who manages resin feeding and packed goods; and periodic support from a quality checker. When you add a second shift, you add a second crew of similar size, not a doubled plant. A third shift follows the same pattern. The result is that labor cost grows in steps with shift count, which is why two-shift and three-shift operation is the normal way to improve the per-bottle labor level without adding machines.
The staffing table below shows a practical crew plan for one IBM line producing small bottles. The numbers are headcounts per shift, not absolute wage figures, because wage levels vary widely by region. What stays true everywhere is the shape: operator-heavy at low automation, handler-light, and quality part-time. Plants that add automatic packing, inline leak testing, and centralized resin feeding can move toward the Low labor level by removing the manual packing role from the shift.
خطة طاقم الوردية لخط IBM واحد
| Role | Per Shift | Two Shifts | Three Shifts | Notes |
|---|---|---|---|---|
| Machine operator | 1 | 2 | 3 | Supervise and sample |
| Material handler | 0.5 | 1 | 1.5 | Resin and packing support |
| الجودة checker | 0.5 | 1 | 1 | Inline or lab checks |
| Line total per shift | 2 | 4 | 5.5 | Scales with shifts |
Two factors push the labor level down over time. The first is training: an operator who knows the Aibim HMI, the SD-card parameter storage system, and the common fault codes resolves minor stops without calling a technician, which raises effective output per crew. The second is automation of the packing and inspection steps, which removes the manual roles from the shift. A plant that runs three shifts with automatic packing and inline testing can reach a Low labor level per bottle even though the shift crew count is higher in absolute terms, because the throughput per crew is much greater. The Wanplas group offers on-site installation, training, and irregular customer visits, which helps a new plant reach competent crewing faster and keeps the labor layer from drifting into the High band during the early months.
التوقف غير المخطط له والتعرض لفقدان الإنتاج
Unplanned downtime is the risk layer that can convert a Low or Medium annual plan into a Very High one. The reason is simple: when the line stops, material and energy stop too, but labor, overhead, and the opportunity cost of missed orders keep running. A failure at the injection station, the blow station, or the stripper station idles the whole three-station cycle, so a single fault removes one hundred percent of line output until it is fixed. For a plant with committed delivery windows, the true cost of that stop includes expedited freight, penalty risk, and lost future orders, none of which appear in a simple parts quote.
The exposure level depends on two things: how often stops happen, and how fast you recover. A plant with a planned maintenance rhythm and an on-site stock of high-wear items typically sees a Low downtime level, with stops measured in minutes and recovered within the shift. A plant that runs until failure, with no spare needles or seals on hand, can see a High or Very High downtime level, with stops measured in shifts. The table below ranks common fault types by recovery difficulty and the annual exposure they create when unmanaged.
أنواع أعطال التوقف والتعرض السنوي
| Fault Type | Typical Recovery | If Unmanaged | Annual Exposure |
|---|---|---|---|
| Blow needle stuck | Minutes with spare | Shift lost | Low to Medium |
| Heater band failure | Hour with spare | Partial day | Medium |
| Hydraulic leak | Hours | Full day | Medium to High |
| Mold cavity damage | Day plus rebuild | Multiple days | High to Very High |
| Control fault | Minutes to hours | Variable | Low to Medium |
The clearest defense is a small on-site spare kit plus a response plan. Because Aibim machines use an SD card to store and clone parameters across machines, a backup line or a swapped controller can be brought back to the exact process setpoint quickly, which shortens control-related recovery. CE-certified safety features such as the long-distance digital laser sensor at the stripper station and the light curtain also reduce the chance that a safety trip turns into a long stop. The annual downtime level is therefore mostly a management choice: invest a little in spares and training, and the layer stays Low; skip them, and one bad week can dominate the year.
خطة الصيانة الوقائية للتحكم في التكلفة السنوية
A preventive maintenance plan is what keeps every other layer in its intended band. The plan should be written, scheduled, and owned by a named person, not left to chance. A practical IBM plan spreads tasks across four intervals so no single shutdown is large. Daily tasks protect availability, weekly tasks protect the Medium energy and wear layers, monthly tasks protect quality and the mold, and the semiannual overhaul protects the whole machine from the Very High failure pattern. The schedule below is expressed in actions and the layer each action protects.
جدول الصيانة الوقائية
| Interval | Key Actions | Protects Layer | Effort Level |
|---|---|---|---|
| Daily | Clean parting line, check alarms, log scrap | Downtime, material | Low |
| Weekly | Lubricate, inspect air leaks, check cooling | الطاقة, wear | Low |
| Monthly | Calibrate, inspect neck inserts, vent check | الجودة, mold | Medium |
| Every 6 months | Overhaul hydraulics, replace wear set | Failure risk | Medium to High |
The semiannual overhaul is the most important single appointment in the year. It is the moment to replace the wear set identified in the Section 4 clock, service the hydraulic power unit, verify the PREFILL system, and confirm the blow needles and seals are fresh before they cause a stop. Plants that keep this appointment almost never see the Very High downtime band. Plants that skip it to chase short-term output usually pay for it within the same year through a cavity or hydraulic failure that removes days of production. The discipline also supports a steadier scrap ratio, because a clean, well-cooled mold produces fewer deformed bottles, which keeps the material layer from creeping upward.
ملف تكلفة التشغيل عبر طرازات IBM
Aibim offers three machine sizes that suit different container volumes and output targets, and their annual operating profiles differ in shape even though they share the same three-station one-step principle. The IBM75 is the largest of the trio and suits higher output of mid-size bottles; its material and energy loads are Higher in absolute terms because it moves more plastic per hour, but its per-bottle levels stay efficient. The IBM65 is the mid-size workhorse for a wide range of pharma, food, and cosmetic containers. The IBM55 Hybrid adds electric assist on selected motions, which lowers the energy layer and makes it attractive for long-run, high-shift plants even though its throughput per hour is the smallest of the three.
The comparison below ranks the three models by the relatable annual operating level of each layer. It is a planning aid, not a substitute for a plant-specific calculation, but it shows the trade-off clearly: bigger machines carry bigger material and energy totals, while the hybrid machine trades some throughput for a lower energy level. All three benefit from the same maintenance rhythm, the same SD-card parameter system, and the same Wanplas shared spare-parts policy.
ملف تكاليف التشغيل السنوي حسب موديل Aibim
| Layer | IBM75 | IBM65 | IBM55 Hybrid |
|---|---|---|---|
| Material level (total) | High | Medium to High | Medium |
| الطاقة level | Medium | Medium | Low |
| العمالة level (per shift) | Medium | Medium | Medium |
| Maintenance level | Medium | Medium | Medium |
| Best fit | High output, mid bottles | General purpose | Long shifts, energy focus |
When comparing the IBM category with other blow molding routes, the operating story is consistent: IBM removes the flash and the post-trim step, which lowers the material scrap and the labor level tied to trimming and deflashing. Extrusion blow molding from suppliers such as Bekum or Milacron often carries a higher flash and trimming workload, while stretch blow routes from specialists such as Aoki or جومار target PET and a different container set. For the pharma, food, drink, and cosmetic bottles in the 3 ml to 1000 ml range that Aibim serves, the IBM one-step process keeps the recurring operating layers in a predictable, manageable band, which is why it is a strong choice for plants that value low scrap and a finished neck without secondary operations. Wanplas, the parent brand, brings the shared quality standards and the open-factory policy that let a buyer verify these claims before committing.
الأسئلة الشائعة
ما نصيب تكلفة التشغيل السنوية لـ IBM التي تأتي من المواد الخام؟
For most injection blow molding lines the plastic resin is the dominant recurring input, typically representing the largest portion of total annual operating cost when measured by consumption volume. The exact share depends on scrap ratio, product weight, and resin grade, but material discipline has the strongest leverage on the yearly total.
كم كهرباء تستهلك آلة IBM لكل كيلوغرام من الزجاجات؟
A three-station injection blow molding machine commonly draws within a moderate energy band per kilogram of finished product when hydraulic, heating, and compressed-air loads are combined. Machines with PREFILL hydraulic technology and servo-optimized pumps sit at the lower end of that band, while older fixed-volume pump designs sit at the higher end.
كم عدد المشغلين المطلوبين لكل وردية لخط IBM واحد؟
A single IBM production line running automatically typically needs a small operator crew per shift for loading, monitoring, sampling, and packing, supported by a part-time material handler. Two or three shifts scale that crew by shift count rather than by machine count, so labor scales with operating hours more than with the number of machines.
أي قطع الغيار يجب إدراجها في الميزانية للاستبدال السنوي؟
Plan a recurring replacement reserve for high-wear items such as nozzle tips, heater bands, blow needles, stripper inserts, seals, and sensor elements. The replacement interval ranges from a few months for the most exposed tooling to more than a year for robust structural components, and the combined level is moderate across a typical yearly cycle.
ما أكبر محرك تكلفة خفي في تشغيل IBM؟
Unplanned downtime is usually the largest hidden cost driver because it removes output while fixed labor and overhead continue. A failure during the blow or injection station can idle the whole three-station cycle, so preventive maintenance and fast spare-part access matter more than the nominal spare-part price.
هل تخفض آلة IBM الكهربائية الهجينة تكلفة التشغيل السنوية؟
A hybrid or all-electric IBM configuration generally lowers the energy portion of annual operating cost because servo drives and variable-displacement pumps avoid the losses of constant-running fixed pumps. The saving is most visible in plants that run long shifts, where the energy reduction compounds across thousands of operating hours each year.
كم مرة يجب إجراء الصيانة الوقائية على خط IBM؟
يجمع الخطة العملية بين الفحوصات اليومية ومهام التزييت والمرشحات الأسبوعية والمعايرة الشهرية والإصلاح الشامل الرئيسي نصف السنوي. توزيع العمل عبر هذه الفترات يبقي الخط في نطاق الصيانة منخفض المخاطر ويتجنب نمط الأعطال غير المخطط عالي التكلفة.
كيف تُقارن IBM بقولبة النفخ بالبثق من حيث تكلفة التشغيل؟
IBM usually produces containers with no flash and a finished neck in one step, which lowers the scrap and secondary-trim labor level. Extrusion blow molding can have a higher flash and post-trim workload. The right choice depends on container shape, volume class, and whether the neck finish must be molded to tight tolerance without a trimming step.
الخلاصة
The annual operating cost of an injection blow molding machine is best understood as four layers: a Very High material layer, two Medium layers for energy and labor, and a Low to Medium maintenance layer that you control to avoid a Very High downtime spike. Manage the scrap ratio first, choose an energy-efficient machine such as an Aibim IBM65 or the IBM55 Hybrid with PREFILL hydraulics for long shifts, staff by shift count rather than by machine count, and keep a written preventive maintenance plan with a semiannual overhaul. Expressed this way, every plant can build a credible yearly cost picture using percentages, kilowatt-hours per kilogram, headcounts, and maintenance intervals instead of guessing a single figure. Aibim, a Wanplas factory with more than twelve years in injection blow molding, an own CNC center, and a one hundred lines per year capacity, designs its IBM75, IBM65, and IBM55 Hybrid machines around exactly these operating-cost levers, and the Wanplas brand’s shared spare-parts and open-factory policies make the maintenance layer predictable. If you are planning or expanding a bottle plant, start from the scrap ratio and the shift plan, because those two decisions shape most of the year’s recurring cost.