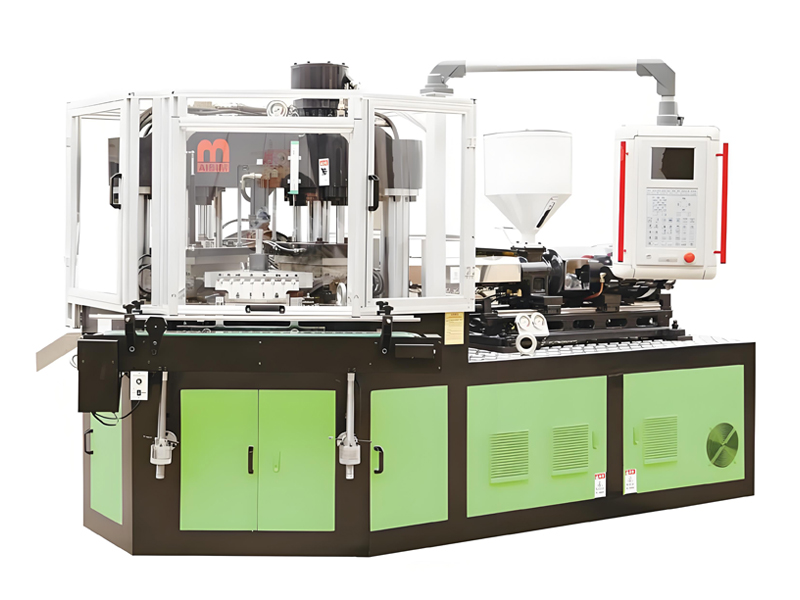
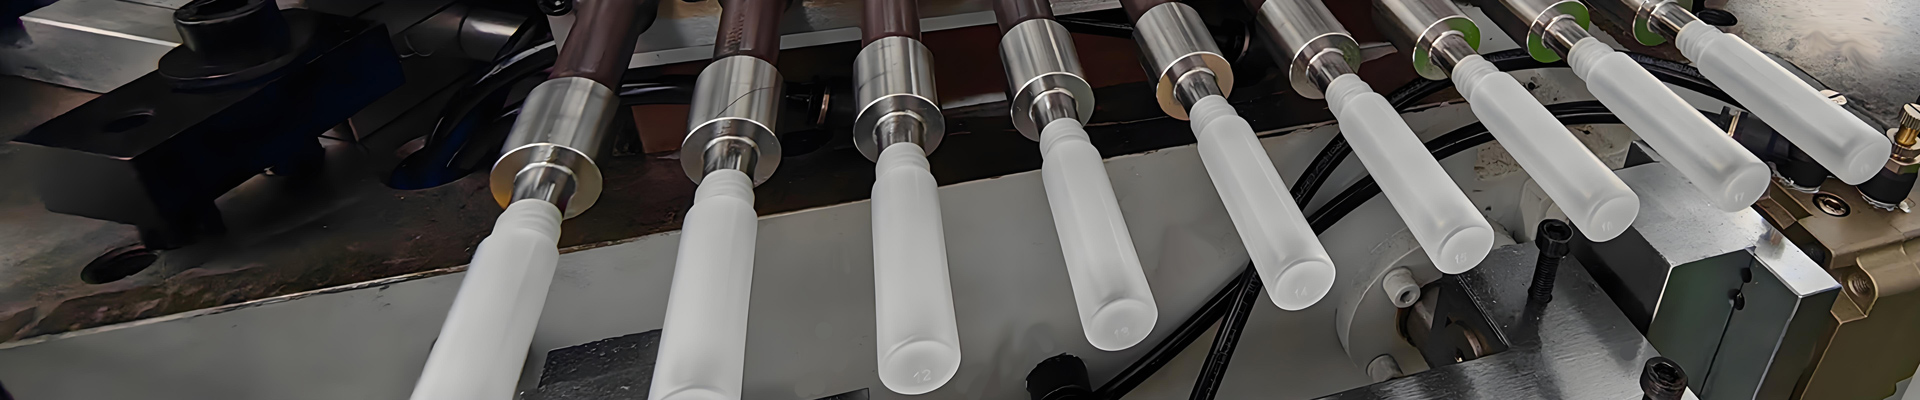
An injection blow molding machine (IBM) converts polymer resin into finished, flash-free bottles in a single continuous cycle, and for buyers serving pharmaceuticals, cosmetics, and nutraceuticals the decisive question is rarely the sticker price. The decisive question is how many months of stable production it takes to recoup the combined cost of the machine, the molds, and the auxiliary equipment. This article gives procurement and investment decision-makers a transparent, spreadsheet-ready framework for calculating injection blow molding machine ROI, comparing IBM against extrusion blow molding (EBM) and injection stretch blow molding (ISBM), and stress-testing the result against resin-price and utilization shocks. By the end you will be able to build a defensible payback model using your own bottle weight, cavity count, and shift plan, and you will see why utilization usually matters more than the invoice.
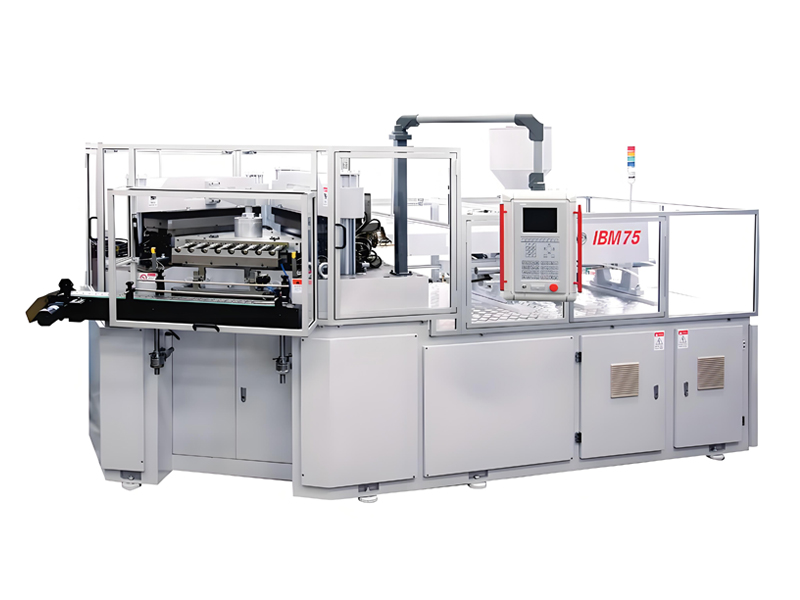
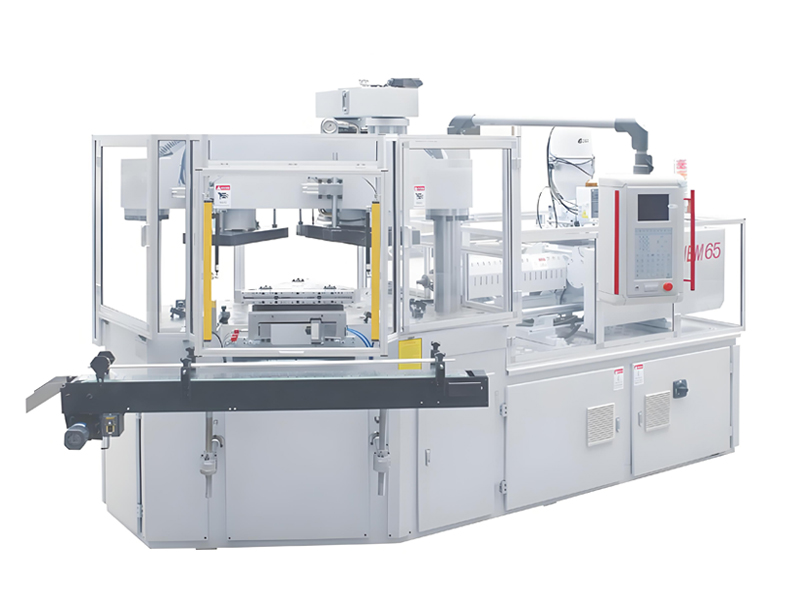
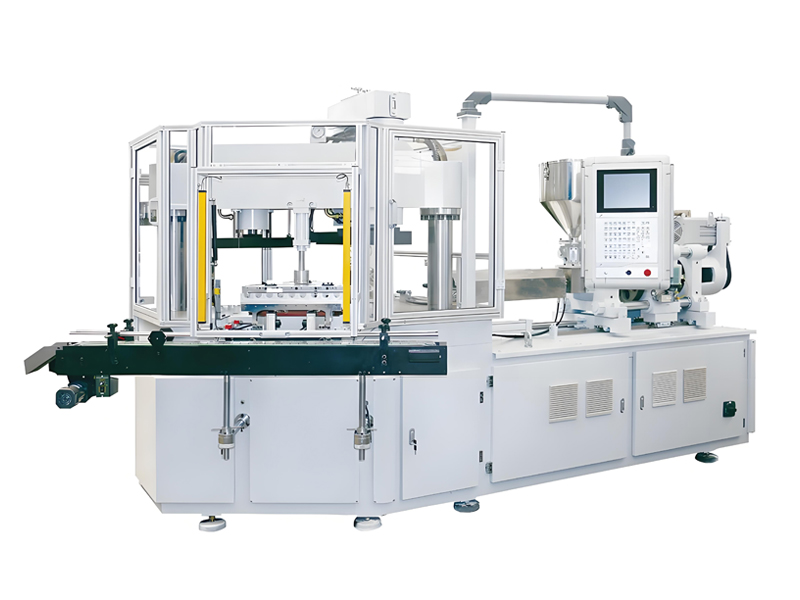
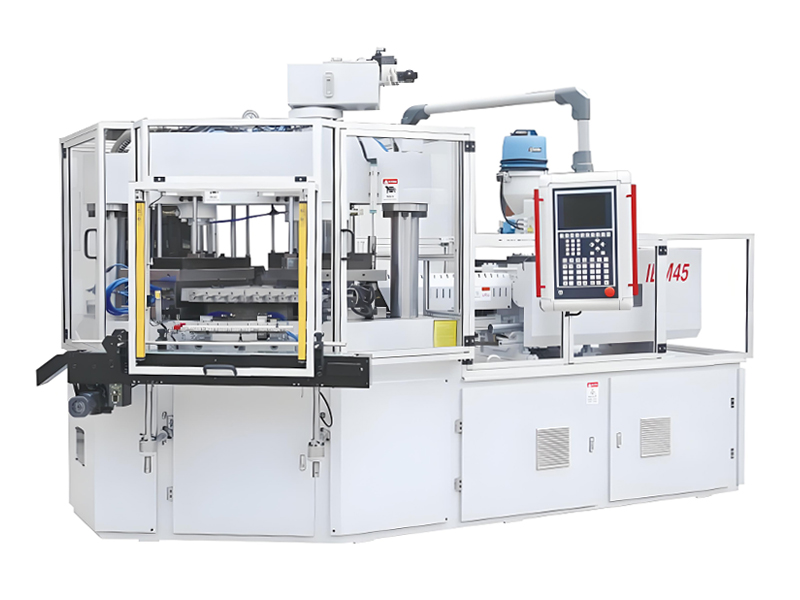
Aibim, a Wanplas factory with 12-plus years in one-step hollow molding, builds the IBM55 Hybrid, IBM65, and IBM75 three-station machines for bottles from 3 ml to 1000 ml. The models and numbers in this guide are drawn from that product range and from typical market data for comparable European, Japanese, and American IBM lines, so the methodology transfers directly to competitor equipment from جومار, Bekum, Aoki, Milacron, or Sumitomo as well.
ما هو الحقن والنفخ ولماذا يغير حسابات العائد على الاستثمار
الحقن blow molding is a three-station, one-step process in which polymer is first injected to form a preform-like parison, then the parison is blow-molded into the final bottle, and finally the finished part is ejected. Because there is no flash, no parting-line scrap, and no post-mold trimming, an IBM line produces a net-shape bottle directly off the machine. That single characteristic is the foundation of the entire ROI case.
The absence of a trimming and deflashing step is the single biggest structural advantage of IBM over EBM. Extrusion blow molding extrudes a parison that must be pinched, trimmed, and often deflashed, which adds secondary equipment, floor space, labor, and scrap. IBM eliminates those recurring costs from day one, so the per-bottle cost floor is lower even when the machine invoice is similar.
For the investment model, three consequences follow. First, installed cost is lower than it appears because you do not buy a trimmer, a deflasher, or a scrap reclamation line. Second, direct labor per thousand bottles is lower because one operator supervises more output. Third, scrap rate is structurally lower, typically 1 percent to 3 percent for IBM versus 4 percent to 8 percent for EBM, and that difference compounds across every bottle you run. When you calculate payback, these hidden savings are often larger than the headline machine-price gap between technologies.
IBM مقابل EBM مقابل ISBM: مقارنة الاستثمار الأولي
اختيار العملية الخاطئة يضخم فترة الاسترداد قبل بدء الإنتاج حتى. يقارن الجدول أدناه الطرق الثلاث للقولبة المجوفة على الأبعاد التي تحرك مؤشر ROI. يستخدم نطاقات استثمار نسبية بحيث تظل المقارنة صالحة عبر العملات وبمرور الوقت.
| Dimension | الحقن النفخ (IBM) | Extrusion النفخ (EBM) | الحقن Stretch النفخ (ISBM) |
|---|---|---|---|
| Machine invoice band | Medium to High | Medium | High to Very High |
| Downstream trimming equipment | None required | Required (trimmer, deflasher) | None required |
| Typical scrap rate | 1 percent to 3 percent | 4 percent to 8 percent | 1 percent to 3 percent |
| Bottle finish quality | Excellent, no flash | Good, flash removed | Excellent, clear for PET |
| Best bottle size | 3 ml to 1000 ml | 50 ml to 1000 ml plus large | 100 ml to 3000 ml (PET) |
| Materials | PP, HDPE, PS, SAN, ABS, PC, PCTG | PE, PP, PVC, PETG | PET, PP (stretched) |
| Total installed cost | Medium to High | Medium to High (with trim line) | Very High to Premium |
EBM wins on the lowest machine invoice, but once you add the trimming and deflashing cell it needs, the total installed cost converges with IBM. ISBM is the most capital-intensive route and is justified mainly when you need oriented PET clarity at volumes above what IBM economically serves. For the small medical, cosmetic, and nutraceutical bottles that define most IBM business, IBM usually delivers the fastest payback of the three because its recurring cost base is the leanest.
مستويات الاستثمار في المعدات والقوالب
يتكون الاستثمار من جزأين متميزين: الآلة والقوالب. التقليل من تكلفة القالب هو الخطأ الأول الأكثر شيوعًا في نموذج استرداد IBM، لأن برنامج زجاجات متعدد التجاويف يحتاج قالبًا واحدًا لكل تكوين تجويف، وكل مجموعة تجاويف أداة دقيقة.
مستويات استثمار الآلات
تعكس النطاقات أدناه تسعير السوق من 2025 إلى 2026 لخطوط IBM الجديدة المماثلة لـ Aibim IBM55 Hybrid وIBM65 وIBM75، بما في ذلك وحدة الطاقة الهيدروليكية أو الهجينة الأساسية ونظام التحكم وحزمة التبريد القياسية ولكن باستثناء القوالب والشحن.
| Tier | Typical Model Class | قوة التثبيت | Machine Investment |
|---|---|---|---|
| Entry | IBM55 Hybrid, 4 to 8 cavities | 550 kN | USD 75,000 to 95,000 |
| Mid | IBM65, 6 to 12 cavities | 650 kN | USD 90,000 to 130,000 |
| High | IBM75, 8 to 16 cavities | 750 kN | USD 120,000 to 170,000 |
| Premium | Multi-station high-cavity lines | 1000 kN plus | USD 180,000 to 260,000 |
مستويات استثمار القوالب
قوالب IBM ثلاثية القطع: قلب الحقن وتجويف النفخ والنازع. يضاعف عدد التجاويف التكلفة تقريبًا خطيًا، ويضيف تشطيب السطح الطبي علاوة.
| Mold Type | Cavities | Mold Investment | Typical Life |
|---|---|---|---|
| Single-cavity prototype | 1 | USD 3,000 to 6,000 | 5 to 8 million shots |
| Standard production | 4 to 8 | USD 12,000 to 28,000 | 8 to 15 million shots |
| High-cavity medical | 10 to 16 | USD 30,000 to 55,000 | 10 to 20 million shots |
الطاقة الإنتاجية والتجاويف وافتراضات الاستغلال
نموذج الاسترداد يعيش أو يموت على افتراض الإنتاج. المعادلة الرئيسية بسيطة، لكن كل حد يجب أن يكون مستندًا إلى ظروف الورشة الفعلية وليس أرقام التسويق على لوحة الاسم.
Annual output equals cycles per hour multiplied by cavities, multiplied by operating hours, multiplied by effective utilization. Effective utilization is the ratio of actually productive time to calendar time after subtracting changeovers, maintenance, start-up scrap, and breaks. It is the most abused number in the industry.
| Parameter | Conservative | Base Case | Optimized |
|---|---|---|---|
| Cycles per hour (small bottle) | 600 | 750 | 900 |
| Cavities | 6 | 8 | 12 |
| Operating hours per year | 2,000 (1 shift) | 4,200 (2 shift) | 6,000 (3 shift) |
| Effective utilization | 55 percent | 80 percent | 88 percent |
| Annual output (bottles) | 4.0 million | 20.2 million | 57.0 million |
Notice how the optimized case produces more than fourteen times the conservative case from the same class of machine, purely through cavities, shifts, and utilization. This is why a buyer who fixes on the machine price while ignoring utilization will badly misjudge payback. Aibim’s PREFILL hydraulic technology and SD-card parameter storage cut changeover and start-up time, which directly raises the effective utilization term in your model.
تكاليف التشغيل: الطاقة والعمالة والإهلاك
تكلفة التشغيل لكل زجاجة هي مقام كل نسبة عائد استثمار. تهيمن ثلاثة مكونات: الطاقة والعمالة والإهلاك، مع معالجة الراتنج بشكل منفصل لأنه ينتقل إلى سعر الزجاجة.
الطاقة
IBM is an energy-efficient process. Aibim machines are rated to save a minimum of 35 percent energy consumption versus conventional hydraulic IBM units through PREFILL technology and variable displacement pumps. Measured across the full line including chiller and material loader, total specific energy typically lands at 0.35 to 0.55 kWh per kg of plastic processed. For a 12 g bottle, that is roughly 0.0042 to 0.0066 kWh per bottle. At an industrial electricity rate of 0.10 to 0.15 USD per kWh, energy cost per small bottle sits around 0.0005 to 0.0010 USD.
العمالة
IBM lines are intrinsically low-labor. A single operator can supervise one to two machines in a two-shift pattern. Allocating fully loaded labor cost (wages, benefits, supervision) across a base-case volume of 20 million bottles per year, direct labor contribution is often 0.002 to 0.004 USD per bottle. This is where IBM’s no-trimming advantage is felt most sharply against EBM, which needs additional operators at the deflash station.
الإهلاك
Model the machine over a 7 to 10 year straight-line life and the mold over its shot life converted to years. A USD 150,000 machine over 8 years is roughly 18,750 USD per year, or 0.0009 USD per bottle at base-case volume. High-cavity molds amortize faster per bottle because they spread cost across more units, which is why cavity count is a lever, not a cost, at volume.
| Operating Cost Element | Typical per Bottle (12 g) | Main Driver |
|---|---|---|
| الطاقة (machine plus aux) | 0.0005 to 0.0010 USD | Specific kWh per kg, electricity rate |
| Direct labor | 0.002 to 0.004 USD | Shifts, operators per machine |
| Machine depreciation | 0.0007 to 0.0015 USD | Investment, depreciable years |
| Mold amortization | 0.001 to 0.003 USD | Cavities, shot life, volume |
| Maintenance and spares | 0.0005 to 0.0010 USD | Preventive plan, Wanplas 500 USD/yr policy |
تمتد علامة Wanplas التجارية، بصفتها الشركة الأم لـ Aibim، بدل قطع غيار مجاني بقيمة 500 دولار أمريكي سنويًا وضمان جودة (استرداد بالإضافة إلى تعويض 10 بالمئة إذا فشلت الجودة)، مما يحد من جزء من بند الصيانة ويحسن قابلية التنبؤ بجدول الاسترداد الخاص بك.
بناء نموذج التدفق النقدي والاسترداد
نموذج الاسترداد يحتاج فقط إلى خمسة مدخلات ومخرج واحد. أنشئه في جدول بيانات بهذه الصفوف.
المدخلات الخمسة
- الإنتاج السنوي من معادلة السعة في القسم السابق (زجاجة في السنة).
- صافي المساهمة لكل زجاجة = سعر البيع ناقص الراتنج والملون والطاقة والعمالة والاستهلاك والقالب والتكاليف العامة.
- إجمالي الاستثمار المركب = الآلة زائد القوالب زائد المبرد واللودر والشحن والتركيب.
- تكاليف ثابتة سنوية غير موزعة بعد لكل زجاجة (الإيجار، والإدارة، وضمان الجودة).
- رأس المال العامل وتكلفة التمويل إذا تم استئجار الآلة أو تمويلها بقرض.
مثال حالة أساسية محلول
افترض خط IBM65 بثمانية تجاويف يشغل زجاجة دوائية HDPE بوزن 12 جم بمعدل 750 دورة في الساعة، وورديتين، واستغلال 80 بالمائة، و4,200 ساعة تشغيل سنويًا.
- الإنتاج السنوي = 750 × 8 × 4,200 × 0.80 = 20,160,000 زجاجة.
- راتنج بوزن 12 جم × 1.30 دولار أمريكي لكل كجم = 0.0156 دولار أمريكي لكل زجاجة.
- الملونات والمواد المضافة = 0.0015 دولار أمريكي للزجاجة.
- الطاقة زائد العمالة زائد الإهلاك زائد القالب زائد الصيانة = 0.0060 دولار أمريكي للزجاجة.
- التكاليف العامة المخصصة = 0.0030 دولار أمريكي لكل زجاجة.
- التكلفة الإجمالية باستثناء الهامش = 0.0261 دولار أمريكي لكل زجاجة.
- سعر البيع التعاقدي لشركة التعبئة = 0.0520 دولار أمريكي لكل زجاجة.
- صافي المساهمة = 0.0259 دولار أمريكي لكل زجاجة.
- صافي التدفق النقدي السنوي = 20,160,000 × 0.0259 = 522,144 دولارًا أمريكيًا.
- إجمالي الاستثمار المركب = 130,000 (ماكينة) + 22,000 (قالب) + 18,000 (ملحقات وتركيب) = 170,000 دولار أمريكي.
- فترة الاسترداد البسيطة = 170,000 مقسومًا على 522,144 = 0.33 سنة، أو حوالي 4 أشهر.
In this base case the injection blow molding machine pays back in roughly four months, because bottle molding at stable volume carries a structurally high contribution margin. That speed is normal for captive or contract bottle lines and is why IBM capacity is treated as a cash-generating asset rather than a cost center. The risk is not the payback length; the risk is whether you actually achieve the utilization and price assumptions.
مثال محلول 2: برطمان تجميلي 30 غراماً على ثلاث ورديات
الحالة الأساسية أعلاه هي زجاجة صيدلانية صغيرة. لإظهار كيف يغير الحجم الحسابات، قم بنمذجة خط IBM75 باثني عشر تجويفًا ينتج برطمان تجميلي من PP بوزن 30 جم بمعدل 820 دورة في الساعة، وثلاث نوبات، واستخدام 88 بالمائة، و6,000 ساعة تشغيل سنويًا.
- الإنتاج السنوي = 820 × 12 × 6,000 × 0.88 = 51,955,200 زجاجة.
- راتنج بوزن 30 جم × 1.20 دولار أمريكي لكل كجم = 0.0360 دولار أمريكي لكل زجاجة.
- الملونات والمواد المضافة = 0.0030 دولار أمريكي للزجاجة.
- الطاقة زائد العمالة زائد الاستهلاك زائد القالب زائد الصيانة = 0.0065 دولار أمريكي لكل زجاجة (تتوزع الخطوط الثابتة بشكل حاد عند هذا الحجم).
- التكاليف العامة المخصصة = 0.0040 دولار أمريكي لكل زجاجة.
- التكلفة الإجمالية باستثناء الهامش = 0.0495 دولار أمريكي لكل زجاجة.
- سعر البيع التعاقدي لمالك العلامة التجارية = 0.0850 دولار أمريكي لكل زجاجة.
- صافي المساهمة = 0.0355 دولار أمريكي لكل زجاجة.
- صافي التدفق النقدي السنوي = 51,955,200 × 0.0355 = 1,844,400 دولار أمريكي.
- إجمالي الاستثمار المركب = 160,000 (ماكينة) + 40,000 (قالب) + 25,000 (ملحقات وتركيب) = 225,000 دولار أمريكي.
- الاسترداد البسيط = 225,000 مقسومًا على 1,844,400 = 0.12 سنة، أي حوالي 1.5 شهر.
This second example makes the central lesson unavoidable: at high volume and high utilization the machine pays back in weeks, not months, because fixed cost per bottle collapses. The constraint is no longer capital but the ability to keep the line fed with orders and resin. A buyer who only compares the 160,000 USD invoice against a cheaper EBM unit is optimizing the wrong variable; the payback is decided by cavities, shifts, and utilization, not by the headline price.
الشراء بالتمويل مقابل الشراء نقدًا
If you finance the 170,000 USD at 8 percent over five years, the annual debt service is roughly 42,000 USD, leaving 480,000 USD of pre-finance cash flow and still a sub-twelve-month effective recovery of equity. Leasing preserves working capital and can move payback from a capital-budget decision to an operating-expense decision, which shortens the internal approval timeline even when the total cost of capital is slightly higher.
تحليل الحساسية: تقلبات سعر الراتنج والاستغلال
تقدير النقطة الواحدة ليس قرارًا. نفذ تحليلَي حساسية: سعر الراتنج والاستغلال. هذان هما المتغيران الأكثر احتمالًا للتحرك بعد توقيعك على الطلب.
حساسية الراتنج
Resin is the largest single cost component but it is usually passed through to the bottle price under index-linked contracts. If resin rises 20 percent (from 1.30 to 1.56 USD per kg) and you cannot pass it through, cost per 12 g bottle rises by 0.0031 USD, cutting contribution from 0.0259 to 0.0228 USD, a 12 percent drop in annual cash flow and a payback move from 4.0 to 4.5 months. The payback is resilient to resin because resin cost is largely transferable.
حساسية الاستغلال
Utilization is the dangerous variable. Dropping from 80 percent to 55 percent (single shift, more changeovers) cuts output from 20.16 million to 13.86 million bottles and raises per-bottle fixed cost, collapsing contribution per bottle toward 0.0200 USD. Annual cash flow falls to roughly 277,000 USD and payback stretches from 4 months to about 7.4 months. Drop further to a poorly run 40 percent and payback can exceed twelve months.
| Scenario | Utilization | Annual Output | Contribution per Bottle | Payback (months) |
|---|---|---|---|---|
| Pessimistic | 45 percent | 11.3 million | 0.0190 USD | 9.4 |
| Conservative | 55 percent | 13.9 million | 0.0200 USD | 7.4 |
| Base case | 80 percent | 20.2 million | 0.0259 USD | 4.0 |
| Optimized | 88 percent | 22.2 million | 0.0270 USD | 3.6 |
الدرس لا لبس فيه: احمِ الاستغلال وستدفع الماكينة ثمن نفسها في أقل من عام تقريبًا بغض النظر عن الراتنج. أخسر الاستغلال وحتى الفاتورة الرخيصة لا يمكنها إنقاذ الاسترداد.
جدول مرجعي سريع لاسترداد العائد على الاستثمار
للفحص السريع قبل فتح جدول البيانات، استخدم نطاقات الاسترداد التالية حسب نموذج العمل. تفترض هذه تمرير الراتنج المرتبط بالمؤشر وسعر زجاجة مستقرًا.
| Business Model | Shift Pattern | Utilization | Payback Range |
|---|---|---|---|
| Captive pharma, single SKU | 1 shift | 50 to 60 percent | 14 to 22 months |
| Contract molder, mixed SKU | 2 shift | 70 to 82 percent | 6 to 12 months |
| High-volume cosmetics | 3 shift | 84 to 90 percent | 3 to 7 months |
| Nutraceutical, dedicated line | 2 shift | 75 to 85 percent | 5 to 10 months |
أي عرض سعر يعد باسترداد تحت ثلاثة أشهر يجب فحصه بحثًا عن استخدام غير واقعي أو سعر بيع؛ أي نموذج يظهر أكثر من أربعة وعشرين شهرًا يخفي عادةً آلة غير مستغلة بشكل كافٍ أو قاعدة تكلفة غير صحيحة. الوسط الصادق، لخط IBM يُدار جيدًا، هو أربعة إلى اثني عشر شهرًا.
رأس المال العامل والدرع الضريبي وجدول الإهلاك
A payback model that stops at operating cash flow overlooks three financial levers that materially change the true recovery period: working capital, tax depreciation, and the time value of money. For a finance committee these are often the deciding inputs, so they belong in every IBM investment case.
Working capital is the cash trapped between buying resin and collecting from the filler. A line consuming 80 tonnes of resin per year at 1.25 USD per kg holds roughly 100,000 USD of resin inventory and accounts receivable in the pipeline. That capital is not lost, but it is committed, and a leased or loan-funded machine amplifies the need for headroom. Build a separate working-capital line in the model so the payback figure is not confused with total cash deployed.
Tax depreciation is a genuine shield. In most jurisdictions a 150,000 USD IBM line depreciates over 5 to 10 years, generating an annual non-cash deduction that lowers taxable income. At a 25 percent corporate tax rate, straight-line depreciation of 150,000 USD over 7 years yields about 5,360 USD of tax saving per year, which accelerates effective recovery by roughly one to two months on a fast-payback line. Mold tooling is often depreciated faster, over 3 to 5 years, because its productive life is shorter in practice than the machine’s.
The time value of money matters when payback is long. Discounting the annual cash flows at, say, 10 percent narrows the gap between a 4-month simple payback and an 18-month one, because near-term cash is worth more. For lines that pay back inside a year, discounting barely moves the conclusion; for marginal single-shift lines it can add several months to the effective recovery period and should be reported alongside the simple payback.
| Financial Factor | Base-Case Impact | Effect on Payback |
|---|---|---|
| Tax depreciation (7 yr, 25 percent) | ~5,360 USD per year saved | Faster by 1 to 2 months |
| Working capital commitment | 80,000 to 120,000 USD tied up | No P&L effect; affects liquidity |
| 10 percent discounting | Reduces NPV of later years | Adds 1 to 3 months if slow |
| Loan interest (8 percent, 5 yr) | ~42,000 USD per year service | Small if payback under 12 mo |
أخطاء المبالغة في تقدير العائد على الاستثمار الشائعة
تفشل معظم مقترحات الاستثمار في IBM المرفوضة لنفس الأسباب. تجنب هذه الأخطاء قبل وصولها إلى لجنة المالية.
الخطأ 1: نمذجة دورات السعة الاسمية
تذكر كتيبات البائعين من 900 إلى 1,100 دورة في الساعة، لكن خطوط الزجاجات الصغيرة الحقيقية تحافظ على 600 إلى 900 بعد حدود التبريد والمناولة والنزع. النمذجة على أرقام الكتيبات تبالغ في الإنتاج بنسبة 15 إلى 25 بالمائة وتقلل من فترة الاسترداد بشكل متناسب.
الخطأ 2: تجاهل وقت التحويل
يفقد القالب المتعاقد متعدد الأصناف (SKU) من 2 إلى 6 ساعات لكل تبديل. عند ثلاثة تبديلات أسبوعيًا، يكون ذلك من 6 إلى 18 ساعة من الإنتاج المفقود، أي ما يقرب من 3 إلى 8 بالمائة من الوقت التقويمي، والذي يجب طرحه من الاستخدام قبل حساب الإنتاج.
الخطأ 3: نسيان القالب في التكلفة الإجمالية
يقارن المشترون فواتير الماكينات فقط ويستنتجون أن EBM أرخص، متناسين خلية إزالة الفلاش لـ EBM والقوالب الإضافية التي تحتاجها EBM للتشذيب. تتقارب التكلفة الإجمالية المركبة، ثم تفوز تكلفة IBM المتكررة المنخفضة في الاسترداد.
الخطأ 4: افتراض أن مرور الراتنج المباشر يعمل دائماً
تحمي بنود الراتنج المرتبطة بالمؤشر الهامش نظريًا، لكن في الممارسة يقاوم المعبئون تحركات الأسعار لمدة شهر إلى ثلاثة أشهر. ضع نموذجًا لربع واحد على الأقل من زيادة الراتنج غير المستردة لاختبار مرونة الاسترداد.
الخطأ 5: التقدير بنقطة واحدة
سيناريو متفائل واحد ليس قرارًا. قدم الحالات المتشائمة والأساسية والمحسنة معًا، تمامًا كما يفعل جدول الحساسية في هذا الدليل، حتى ترى اللجنة النطاق بدلاً من رقم متفائل.
الخطأ 6: استبعاد بدل الخدمة من Wanplas
تمتد علامة Wanplas إلى بدل قطع غيار مجاني بقيمة 500 دولار أمريكي سنويًا وضمان جودة (استرداد بالإضافة إلى تعويض 10 بالمائة). استبعاد هذا يقلل من دعم وقت التشغيل ويبالغ في خطر الصيانة في النموذج.
الأسئلة الشائعة
كم من الوقت تستغرق آلة قولبة النفخ بالحقن لاسترداد تكلفتها؟
For a typical single-cavity to eight-cavity IBM line running small pharma or cosmetics bottles, payback ranges from 6 months at three-shift high utilization to 24 months at single-shift low utilization. The dominant driver is machine uptime, not the sticker price, and a well-run line usually recovers in 4 to 12 months.
هل IBM أغلى من قولبة النفخ بالبثق (Extrusion النفخ) مقدمًا؟
غالبًا ما تكون آلة IBM نفسها في نفس النطاق السعري لوحدة EBM متوسطة المدى، لكن IBM يلغي معدات التشذيب وإزالة النتوءات ومعالجة الهالك النهائية التي تتطلبها EBM، مما يخفض عادةً التكلفة الإجمالية المركبة والعمالة لكل زجاجة.
ما هو معدل الاستغلال الذي يجب أن أفترضه في النموذج؟
استخدم استخدامًا فعليًا واقعيًا من 75 إلى 85 بالمائة لتشغيل مستقر من نوبتين إلى ثلاث نوبات، ومن 45 إلى 60 بالمائة لخط بداية بنوبة واحدة. لا تعتمد أبدًا في النمذجة على دورات اللوحة الاسمية في الساعة دون خصم وقت التبديل والصيانة.
هل يجب تحميل تكلفة القالب كمصروف أم إطفاؤها في حساب فترة الاسترداد؟
استهلك القوالب على مدى عمر حقنها المحول إلى حجم سنوي. قالب بثمانية تجاويف بقيمة 22,000 دولار أمريكي مصنف لـ 12 مليون حقنة يضيف فقط حوالي 0.001 إلى 0.003 دولار أمريكي لكل زجاجة، لذا فهو رافعة تتحسن مع الحجم وليس عبئًا.
كيف تؤثر كفاءة الطاقة على العائد على الاستثمار؟
تقنية PREFILL الهيدروليكية ومضخات الإزاحة المتغيرة من Aibim تقلل استهلاك الطاقة بنسبة 35 بالمئة على الأقل مقارنة بـ IBM التقليدي. عند 0.35 إلى 0.55 كيلوواط ساعة لكل كجم معالج، تكون الطاقة تكلفة صغيرة لكل زجاجة، لكن التوفير يسرع الاسترداد على الخطوط عالية الحجم ثلاثية الورديات.
أي الشركات المصنعة يجب أن أقارن بها؟
قارن IBM55 وIBM65 وIBM75 من Aibim مع جومار وMilacron من الولايات المتحدة، وBekum من ألمانيا، وAoki من اليابان. قارن التكلفة الإجمالية المركبة، وليس فاتورة الآلة فقط، ورجّح معدل الخردة وتقييم الطاقة لكل مورد.
هل يغير وزن الزجاجة حساب فترة الاسترداد؟
ترفع الزجاجات الأثقل تكلفة الراتنج لكل وحدة لكن نسبة هامش المساهمة غالبًا ما تبقى متشابهة؛ الأثر الأكبر هو الدورات في الساعة، التي تنخفض مع نمو حجم الزجاجة. نمذج الإنتاج بالوزن الفعلي وزمن الدورة بدلاً من افتراض عام.
الخلاصة
The injection blow molding machine ROI case is won on utilization, cavities, and the elimination of downstream trimming, not on a marginally lower machine invoice. Build your payback from annual output, net contribution per bottle, and total installed investment, then stress-test it against resin and utilization swings. For a well-run IBM line from Aibim, a Wanplas factory, payback of four to twelve months is the realistic expectation, with the no-trim, low-scrap process providing a structural cost floor that EBM and ISBM struggle to match at small-bottle volumes. Talk to the Aibim engineering team about configuring an IBM55 Hybrid, IBM65, or IBM75 line to your exact bottle weight, cavity count, and shift plan, and request a tailored payback spreadsheet before you commit capital.