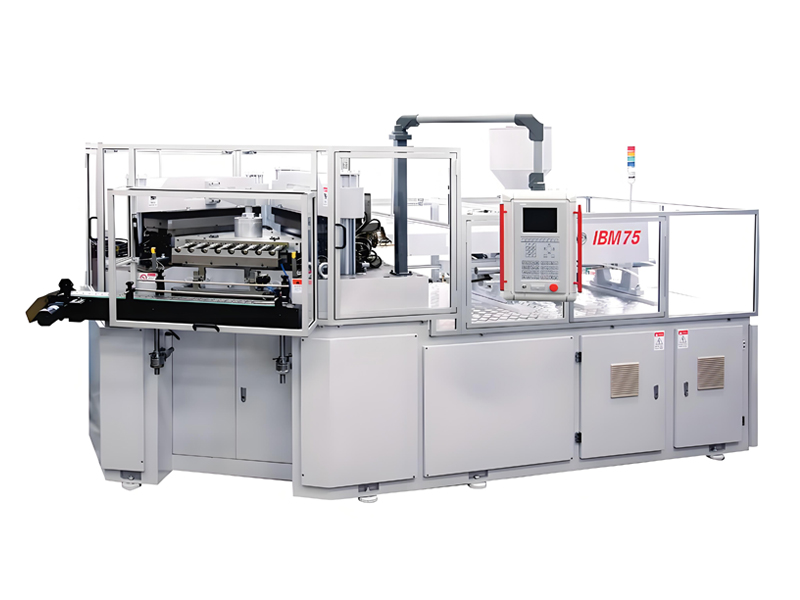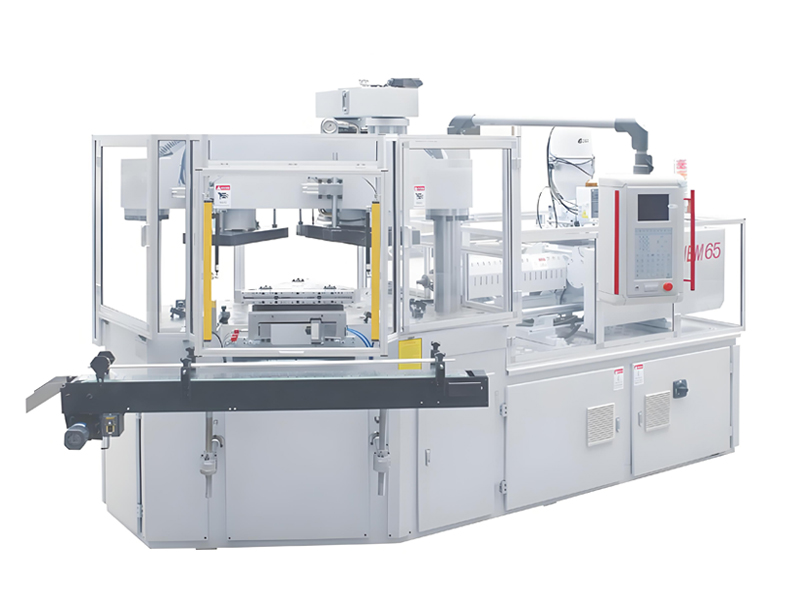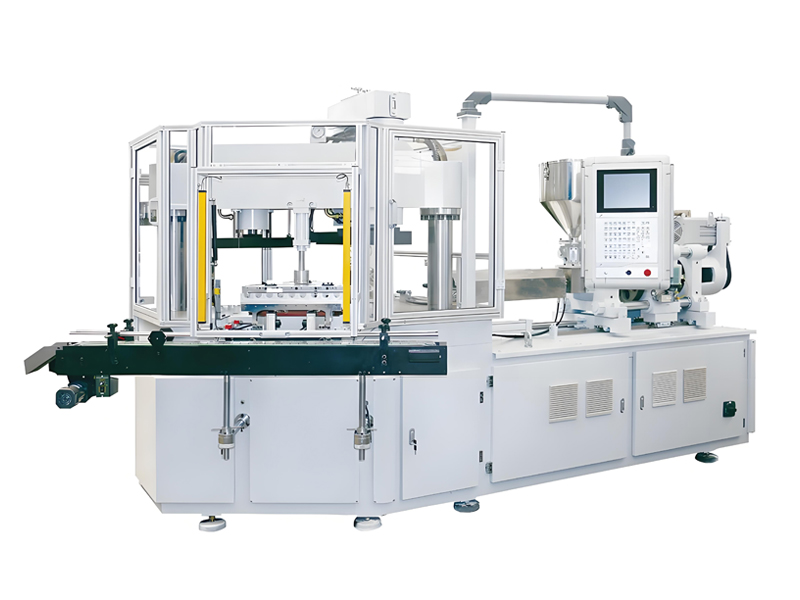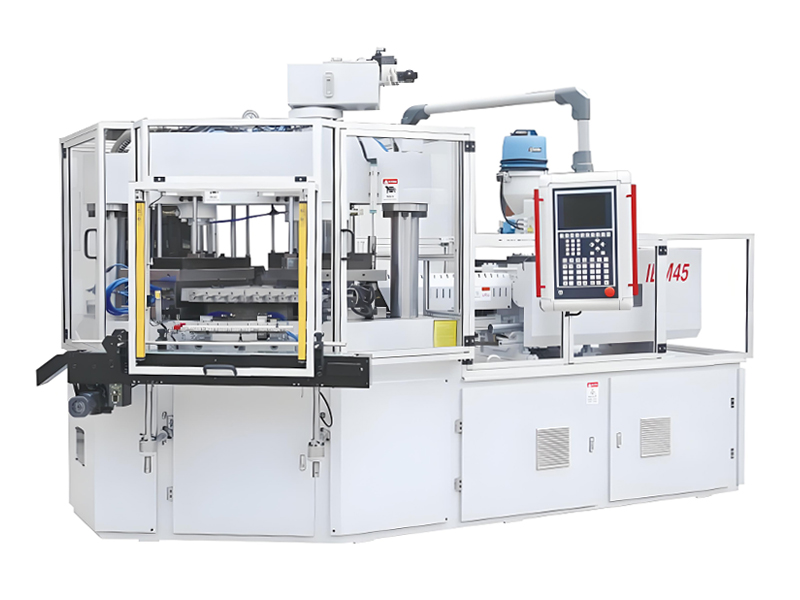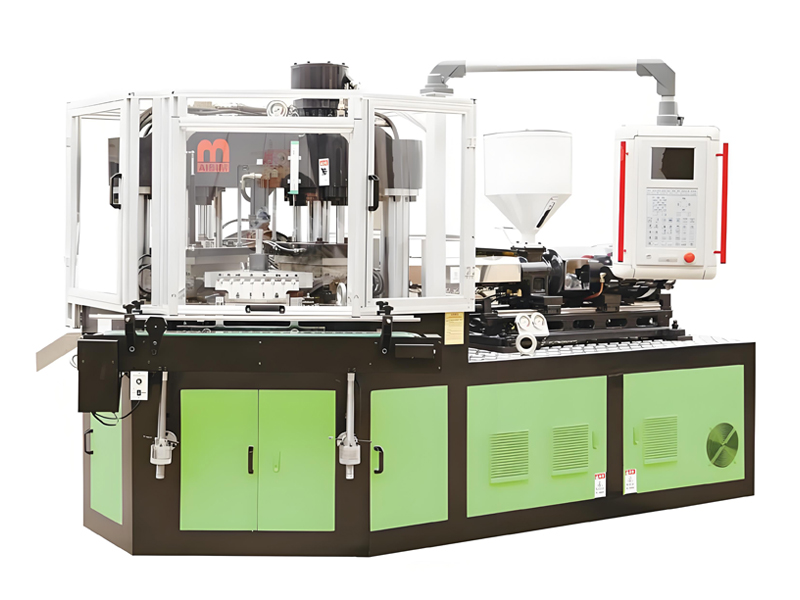
Unit production cost is the number that decides whether an injection blow molding (IBM) program is profitable. Procurement and operations leaders need more than a machine price; they need a defensible cost per plastic bottle that survives a finance review. This article dissects the full per-bottle cost stack for IBM, from polymer resin and colorant through energy, labor, mold amortization, scrap, packaging, and indirect overhead. Using Aibim’s IBM55 Hybrid, IBM65, and IBM75 three-station machines as the reference platform, it gives concrete figures for bottle weight, cavity count, kWh per kg, scrap percentage, and utilization, then lays out a cost-comparison table across weight and output tiers and a checklist of reduction levers. By the end you can estimate your own unit cost to within a realistic band and avoid the miscalculations that quietly destroy margin.
Aibim is a Wanplas factory with 12-plus years in one-step hollow molding, serving pharmaceutical, food, drink, and cosmetic bottle markets with bottles from 3 ml to 1000 ml. The methodology here applies equally to competitor IBM platforms from Jomar, Bekum, Aoki, Milacron, and Sumitomo, because the cost structure of the process is shared even when the invoice differs.
Unit cost matters most at the quoting stage, where an error of even 0.005 USD per bottle compounds into tens of thousands of dollars across a multi-million-unit annual program. A molder who undercosts loses margin silently; one who overcosts loses the order to a competitor with a tighter, equally valid model. The goal of this guide is to give you a defensible number, not a hopeful one, by making every assumption explicit and every line item attributable to a physical input. Treat the tables as starting points to be overwritten with your own resin contract, electricity tariff, wage rate, and cavity plan, and the result will survive both a customer audit and an internal finance review. Throughout, the structural advantages of injection blow molding, the elimination of trimming and the inherently low scrap rate, are credited where they belong so the comparison against extrusion blow molding stays honest.
Anatomy of a Single-Bottle Cost
The unit cost of an injection blow molded bottle is the sum of every resource consumed to make one shippable, good bottle. The cleanest way to model it is as a stack of additive components, each expressed in USD per good bottle.
A good bottle is the only unit that earns revenue, so every cost must be divided by good output, not by total shots. This single discipline separates an accurate model from an optimistic one, because it forces scrap, start-up waste, and changeover loss into the denominator where they belong.
The standard cost stack, in order of magnitude, is: resin and colorant, energy, direct labor, mold amortization, machine depreciation, maintenance and spares, scrap premium, packaging, logistics, and indirect overhead. Resin is almost always the largest line, typically 55 percent to 70 percent of total unit cost for a small bottle, while energy and labor together are often under 15 percent. That ranking tells you where to focus: you control margin most by managing material and scrap, and you protect it with process efficiency.
Resin and Colorant: The Dominant Variable
Resin cost equals bottle weight multiplied by resin price per kg, plus the colorant or additive load. Because IBM is a net-shape, flash-free process, the resin you buy is almost exactly the resin in the bottle, with only minimal start-up and gate waste.
| Material | Typical Price Band | Best IBM Use |
|---|---|---|
| PP (homopolymer) | 1.10 to 1.40 USD per kg | Pharma, cosmetics, food |
| HDPE | 1.00 to 1.30 USD per kg | Pharma, personal care |
| PS / SAN | 1.20 to 1.60 USD per kg | Clear cosmetic, diagnostic |
| PCR / medical grade | 1.50 to 2.20 USD per kg | Regulated pharma, EU 10/2011, FDA |
| Colorant / masterbatch | 3 to 8 USD per kg of additive | 1 to 4 percent let-down |
For a 12 g PP bottle at 1.25 USD per kg, resin alone is 0.0150 USD. A 2 percent white masterbatch at 4.00 USD per kg adds 0.0010 USD, bringing material to 0.0160 USD. The cost scales almost linearly with bottle weight: a 5 g bottle costs about 0.0067 USD in resin, a 30 g bottle about 0.0375 USD. The practical implication is that lightweighting a bottle by even 10 percent cuts the largest cost line by 10 percent with no change to the machine.
Energy Consumption per Bottle
Energy in IBM covers the injection press, the blow station, the chiller, the material loader, and compressed air. Measured at the line boundary, total specific energy lands at 0.35 to 0.55 kWh per kg of plastic processed for a conventional hydraulic IBM, and Aibim’s PREFILL technology with variable displacement pumps reduces that by a minimum of 35 percent, pushing the efficient band toward 0.30 to 0.40 kWh per kg.
| Bottle Weight | Energy per kg | kWh per Bottle | Cost at 0.12 USD per kWh |
|---|---|---|---|
| 5 g | 0.40 kWh | 0.0020 | 0.00024 USD |
| 12 g | 0.40 kWh | 0.0048 | 0.00058 USD |
| 30 g | 0.40 kWh | 0.0120 | 0.00144 USD |
Energy is a small but steady cost. At 0.12 USD per kWh, even a 30 g bottle carries only about 0.0014 USD of energy, so the absolute saving from efficiency is modest per bottle but meaningful across hundreds of millions of units per year. The bigger value of Aibim’s energy design is heat reduction and stability on three-shift lines, which protects cycle time and utilization, the variables that actually decide unit cost.
Labor and Direct Overhead
IBM is a low-direct-labor process. One trained operator can supervise one to two machines, and the absence of a trimming or deflashing station removes an entire labor step that extrusion blow molding requires. Direct labor cost per bottle depends almost entirely on shift pattern and output volume.
| Shift Pattern | Annual Output | Loaded Labor Cost | Labor per Bottle |
|---|---|---|---|
| 1 shift | 4 to 7 million | 35,000 to 45,000 USD | 0.006 to 0.011 USD |
| 2 shift | 14 to 22 million | 70,000 to 90,000 USD | 0.003 to 0.006 USD |
| 3 shift | 40 to 57 million | 105,000 to 135,000 USD | 0.002 to 0.003 USD |
Direct overhead such as supervision, quality inspection, and line utilities typically adds another 0.001 to 0.003 USD per bottle at volume. The pattern is clear: labor falls sharply per bottle as you add shifts, which is why a two-shift or three-shift IBM line is dramatically cheaper per unit than a single-shift line running the same machine.
Mold Amortization Across Cavity Count
IBM molds are precision three-piece tools whose cost scales roughly with cavity count. Amortizing mold cost over good bottles turns a capital outlay into a tiny per-unit figure that shrinks as volume rises.
| Cavities | Mold Investment | Shot Life | Amortization per Bottle |
|---|---|---|---|
| 4 | USD 12,000 | 10 million | 0.00120 USD |
| 8 | USD 22,000 | 12 million | 0.00183 USD |
| 12 | USD 38,000 | 15 million | 0.00253 USD |
| 16 | USD 52,000 | 18 million | 0.00289 USD |
Although a 16-cavity mold costs more than four times a 4-cavity mold, its per-bottle amortization is only about 2.4 times higher because its shot life is longer. More importantly, higher cavitation raises output per cycle, which lowers every other fixed cost line. Mold amortization is therefore a lever that improves with volume, not a penalty, provided you actually run the cavities you paid for.
Scrap Rate and Its Hidden Multiplier
Scrap is the silent cost multiplier in IBM. Because cost is divided by good bottles, every rejected unit forces the material, energy, and labor of good units to absorb the loss. IBM’s net-shape process keeps scrap low, typically 1 percent to 3 percent, versus 4 percent to 8 percent for extrusion blow molding, but the discipline of counting it correctly matters.
| Scrap Rate | Extra Material per Good Bottle | Total Cost Premium |
|---|---|---|
| 1 percent | 1.0 percent | 1.0 to 1.5 percent |
| 3 percent | 3.1 percent | 3.0 to 4.5 percent |
| 7 percent | 7.5 percent | 7.5 to 10.0 percent |
A scrap rate that drifts from 2 percent to 7 percent can add 5 percent to 9 percent to total unit cost before anyone notices, because the loss hides inside the good-bottle denominator. Aibim’s CE-certified stripper station with long-distance digital laser sensors and light curtain protection reduces jam-related scrap, and SD-card parameter storage lets you reload a proven process recipe across machines, cutting start-up waste during changeovers. Tight scrap control is one of the cheapest, highest-impact cost levers available.
Packaging, Logistics, and Indirect Overhead
The last cost layers appear after the bottle leaves the machine. These are often excluded from naive models and are exactly where budgets break.
Packaging
Small bottles are typically packed in PET or PE bags inside corrugated cartons, or in reusable totes for cleanroom pharma flows. Packaging ranges from 0.0010 to 0.0040 USD per bottle depending on whether the line uses bulk gaylord packing or individual cartons, and whether cleanroom requirements force single-use films.
Logistics
Outbound freight depends on bottle density and distance. Nested empty bottles are voluminous, so freight can reach 0.002 to 0.008 USD per bottle to a regional filler and more to intercontinental destinations. In-house filling eliminates this line entirely, which is why many IBM operators integrate downstream filling.
Indirect Overhead
Factory rent, utilities beyond the line, QA labs, management, and administrative cost typically add 0.002 to 0.005 USD per bottle at volume. The Wanplas brand, as Aibim’s parent, carries shared service promises including a 500 USD-value free spare parts allowance per year and a quality guarantee, which cap a portion of indirect maintenance cost and improve cost predictability.
The interaction between packaging, logistics, and overhead is often where small-bottle programs lose control of unit cost, because these lines are billed per case or per pallet rather than per bottle and are easy to undercount. A useful discipline is to convert every case and pallet charge back to a per-bottle figure during the model build, exactly as the comparison table does, so that a freight surcharge or a switch from bulk to carton packing shows up immediately as a movement in total unit cost. Captive operations that fill in-house eliminate outbound bottle logistics entirely but pick up filling-line overhead instead; the two should be modeled side by side rather than assumed away. For contract molders serving multiple fillers, building a per-destination logistics matrix prevents a single expensive lane from distorting the blended unit cost used for quoting.
Cost Comparison Across Bottle Weight and Output Tiers
The table below consolidates the stack into a total unit cost for representative configurations of Aibim IBM lines. All figures are USD per good bottle and assume index-linked resin, 80 percent utilization, and a two-shift pattern unless noted.
| Configuration | Bottle Weight | Annual Output | Resin plus Color | Energy plus Labor | Mold plus Depr. | Pkg plus OH | Total Unit Cost |
|---|---|---|---|---|---|---|---|
| IBM55, 6 cav, 1 shift | 5 g | 5.0 million | 0.0071 USD | 0.0080 USD | 0.0040 USD | 0.0050 USD | 0.0241 USD |
| IBM65, 8 cav, 2 shift | 12 g | 20.2 million | 0.0160 USD | 0.0040 USD | 0.0030 USD | 0.0040 USD | 0.0270 USD |
| IBM75, 12 cav, 2 shift | 12 g | 30.2 million | 0.0160 USD | 0.0030 USD | 0.0035 USD | 0.0035 USD | 0.0260 USD |
| IBM75, 12 cav, 3 shift | 30 g | 45.0 million | 0.0385 USD | 0.0035 USD | 0.0030 USD | 0.0055 USD | 0.0505 USD |
| IBM65, 8 cav, 1 shift | 12 g | 10.1 million | 0.0160 USD | 0.0090 USD | 0.0040 USD | 0.0060 USD | 0.0350 USD |
Two insights stand out. First, the 12 g bottle is cheaper per unit at higher cavitation and more shifts (0.0260 USD) than at single shift (0.0350 USD), purely from fixed-cost dilution. Second, resin dominates every row, confirming that material strategy and scrap control outweigh machine-selection fine points for total cost.
Cost-Reduction Levers Checklist
Use this checklist to drive unit cost down on any Aibim IBM line.
- Lightweight the bottle by 5 percent to 15 percent through wall-thickness and base optimization; cuts resin, the largest line, proportionally.
- Negotiate resin on index-linked contracts and buy at volume brackets; even 0.05 USD per kg saves 0.0006 USD on a 12 g bottle.
- Reduce masterbatch let-down from 3 percent to 1.5 percent where color permits; halves the colorant line.
- Maximize cavitation to 8, 12, or 16 cavities to dilute mold and depreciation per bottle.
- Run two or three shifts to spread labor and overhead across more units; single shift is the most expensive mode per bottle.
- Cut scrap to under 2 percent with process recipes stored on SD card and CE-certified stripper sensing that prevents jams.
- Adopt PREFILL hydraulics on Aibim machines to save at least 35 percent energy versus conventional IBM.
- Integrate downstream filling where possible to eliminate outbound bottle logistics.
- Use reusable totes instead of single-use cartons for captive or regional flows.
- Apply the Wanplas 500 USD/year spare parts allowance and preventive maintenance to avoid unplanned downtime that raises effective unit cost.
Common Cost-Miscalcuation Traps
Most bad IBM cost estimates fail in the same predictable ways. Avoid these.
Trap 1: Dividing by Total Shots, Not Good Bottles
Using nameplate output instead of good output understates cost by the scrap rate. Always divide by good bottles, and include start-up and changeover waste in the scrap assumption.
Trap 2: Ignoring the Trimming Step in EBM Comparisons
When benchmarking against extrusion blow molding, a naive model omits the deflash station labor and equipment. IBM’s no-trim advantage must be credited or the comparison is invalid.
Trap 3: Using Nameplate Cycles per Hour
Marketing cycle rates assume perfect conditions. Real lines run 600 to 900 cycles per hour for small bottles after cooling and handling limits; model 80 percent to 88 percent of nameplate at best.
Trap 4: Treating Resin as Fixed
Resin is 55 percent to 70 percent of cost and moves with polymer markets. Build in a plus-or-minus 20 percent resin sensitivity rather than a single frozen price.
Trap 5: Forgetting Packaging and Logistics
These post-machine lines add 0.003 to 0.013 USD per bottle. Excluding them makes a captive line look cheaper than a delivered one unfairly, and vice versa.
Trap 6: Under-Allocating Overhead
Factory rent, QA, and administration do not disappear at volume; they simply dilute. Allocate at least 0.002 to 0.005 USD per bottle or the model will look artificially lean.
Material-Specific Cost Comparison
Resin choice moves unit cost more than any machine setting, because material price and density differ widely across polymers. The table below compares the per-bottle material cost for a 12 g bottle in four common IBM materials at representative price bands, holding all other cost lines equal.
| Material | Price Band | Resin Cost (12 g) | Typical Application |
|---|---|---|---|
| PP homopolymer | 1.10 to 1.40 USD per kg | 0.0132 to 0.0168 USD | Pharma, cosmetics, food |
| HDPE | 1.00 to 1.30 USD per kg | 0.0120 to 0.0156 USD | Personal care, pharma |
| PS / SAN | 1.20 to 1.60 USD per kg | 0.0144 to 0.0192 USD | Clear cosmetic, diagnostic |
| Medical / PCR grade | 1.50 to 2.20 USD per kg | 0.0180 to 0.0264 USD | Regulated pharma, EU 10/2011, FDA |
The spread between commodity HDPE and regulated medical grade is roughly 0.006 to 0.010 USD per 12 g bottle, or 20 percent to 60 percent of the entire non-material cost stack. For a regulated pharma bottle the material premium is unavoidable, but for a standard cosmetic or nutraceutical bottle, selecting PP over a premium clear grade can cut unit cost meaningfully without changing the machine. Aibim’s IBM lines process all of these materials on the same platform, so material strategy is a pure commercial decision rather than a capital one.
Utility Rate and Geography Sensitivity
Energy is a small share of unit cost, but because electricity rates vary widely by region, the absolute energy line can shift several-fold without changing the machine. The table illustrates the energy cost per 12 g bottle across typical industrial tariffs.
| Region Tariff | USD per kWh | Energy per 12 g Bottle | Annual Energy (20M bottles) |
|---|---|---|---|
| Low tariff | 0.06 | 0.00029 USD | 5,760 USD |
| Mid tariff | 0.12 | 0.00058 USD | 11,520 USD |
| High tariff | 0.22 | 0.00106 USD | 21,120 USD |
Even at the highest tariff, energy for a 12 g bottle is about 0.0011 USD, a fraction of total cost, so siting decisions should weigh labor and logistics far more than power price for small-bottle IBM. Aibim’s PREFILL hydraulic design, which cuts energy consumption by at least 35 percent, matters most in high-tariff markets and on three-shift lines where cumulative kWh are largest. The bigger geographic lever is labor: a region with loaded operator cost of 12,000 USD per year versus 40,000 USD per year changes per-bottle labor by 0.001 to 0.004 USD, which dwarfs the energy tariff effect.
Five-Year Total Cost of Ownership
Per-bottle cost answers the unit question; total cost of ownership answers the asset question. For a capital approval you need both. The table below projects a five-year cost stack for the base-case IBM65 eight-cavity line running 12 g PP bottles at two shifts, 80 percent utilization, 20.2 million bottles per year, with resin, energy, labor, mold, depreciation, maintenance, packaging, and overhead summed and then expressed per bottle.
| Cost Category | Per Year | Five Years | Per Bottle |
|---|---|---|---|
| Resin plus colorant | 323,200 USD | 1,616,000 USD | 0.0160 USD |
| Energy plus labor | 80,800 USD | 404,000 USD | 0.0040 USD |
| Mold plus depreciation | 60,600 USD | 303,000 USD | 0.0030 USD |
| Maintenance plus overhead | 101,000 USD | 505,000 USD | 0.0050 USD |
| Packaging plus logistics | 80,800 USD | 404,000 USD | 0.0040 USD |
| Total | 646,400 USD | 3,232,000 USD | 0.0320 USD |
Over five years this line consumes about 3.23 million USD of total cost to produce roughly 101 million bottles, an average unit cost of 0.0320 USD once the first year’s slightly higher start-up scrap is averaged out. Set against the 0.0520 USD contract price, the cumulative gross margin across five years is roughly 2.02 million USD, comfortably covering the 170,000 USD installed investment many times over. The Wanplas brand’s 500 USD annual free-parts allowance and quality guarantee are folded into the maintenance line, improving the predictability of the five-year figure. The takeaway for procurement is that the per-bottle model and the five-year ownership model tell the same story: material and utilization dominate, and the IBM process structure keeps recurring cost low enough to make the asset self-funding within the first year.
Frequently Asked Questions
What is the typical unit cost of an injection blow molded bottle?
For a 12 g HDPE or PP small bottle at volume, total unit cost typically ranges from 0.024 USD to 0.045 USD per bottle depending on resin grade, cavity count, and overhead allocation. Resin is usually 55 percent to 70 percent of that cost, and optimized high-cavitation three-shift operation can reach the lower end of the band.
Which cost element is largest in IBM?
Resin and colorant dominate, accounting for the majority of per-bottle cost. Energy, labor, and mold amortization are comparatively small and are where process efficiency, such as Aibim’s PREFILL hydraulic system, recovers the most margin. This ranking is why a 5 percent resin saving outweighs a 20 percent energy saving in absolute unit-cost terms, and why material specification decisions deserve as much engineering attention as machine selection.
How much does scrap add to unit cost?
At a 2 percent scrap rate, you consume roughly 2 percent more resin and energy per good bottle; at an uncontrolled 7 percent rate the hidden multiplier can add 5 percent to 9 percent to total unit cost, which is why scrap control is a top reduction lever.
Does higher cavitation always lower unit cost?
Almost always, because mold and depreciation spread across more bottles per cycle. The exception is when high cavitation is paired with low utilization, where the unused capacity fails to dilute fixed cost and the mold premium is wasted. A practical rule is to size cavitation to at least 70 percent of expected steady demand rather than to the peak, reserving the headroom for surge orders without committing fixed cost to idle cavities.
How should energy be calculated per bottle?
Multiply bottle weight in kg by specific energy (about 0.30 to 0.55 kWh per kg for IBM) to get kWh per bottle, then multiply by your electricity rate. At 0.12 USD per kWh a 12 g bottle costs about 0.0006 USD in energy.
Is single-shift IBM ever cost-competitive?
Only for low-volume or captive niche bottles where utilization is naturally limited. For standard pharma or cosmetics volumes, two or three shifts are needed to reach competitive unit costs because labor and overhead dilute poorly at single shift.
How do I compare IBM cost to EBM cost fairly?
Add EBM’s deflashing and trimming labor and equipment, plus its higher 4 percent to 8 percent scrap, to its per-bottle model. On a like-for-like basis IBM usually wins on recurring cost for small bottles despite a similar machine invoice.
What overhead should I allocate per bottle?
Allocate factory rent, QA, administration, and indirect utilities at a minimum of 0.002 to 0.005 USD per bottle at volume. Excluding overhead makes the model look lean but breaks the finance review.
Conclusion
The unit production cost of an injection blow molded bottle is governed first by resin and scrap, then by how well you dilute fixed cost through cavitation and shifts. For a reference Aibim IBM65 or IBM75 line, a 12 g bottle lands near 0.0260 to 0.0350 USD depending almost entirely on utilization, with energy and labor contributing only a small, controllable share. The levers that matter are lightweighting, scrap discipline, cavitation, and shift count, supported by Aibim’s PREFILL energy-saving hydraulics and CE-certified stripper sensing. Build your model on good-bottle output, include packaging and overhead, and stress-test resin; do that and your per-bottle cost will hold up to scrutiny. Contact the Aibim engineering team, part of the Wanplas brand, for a tailored cost model based on your exact bottle weight, material, cavity count, and annual volume.