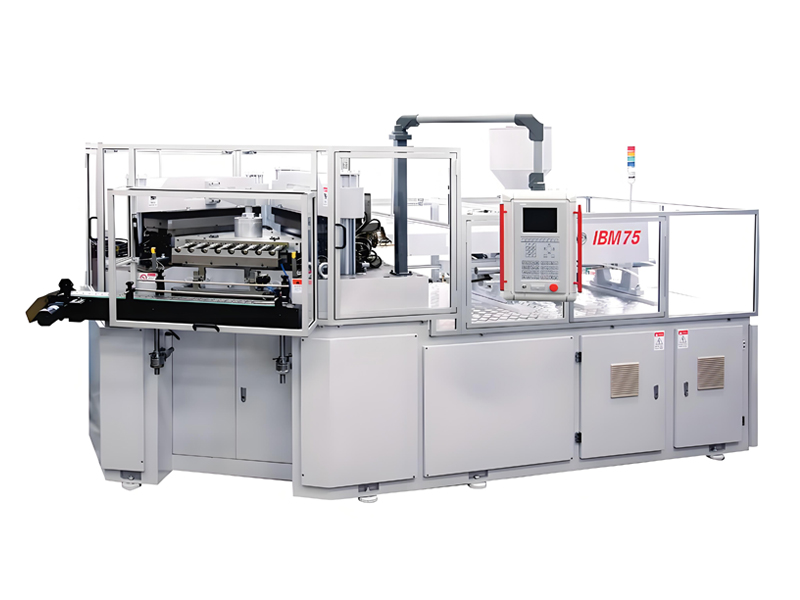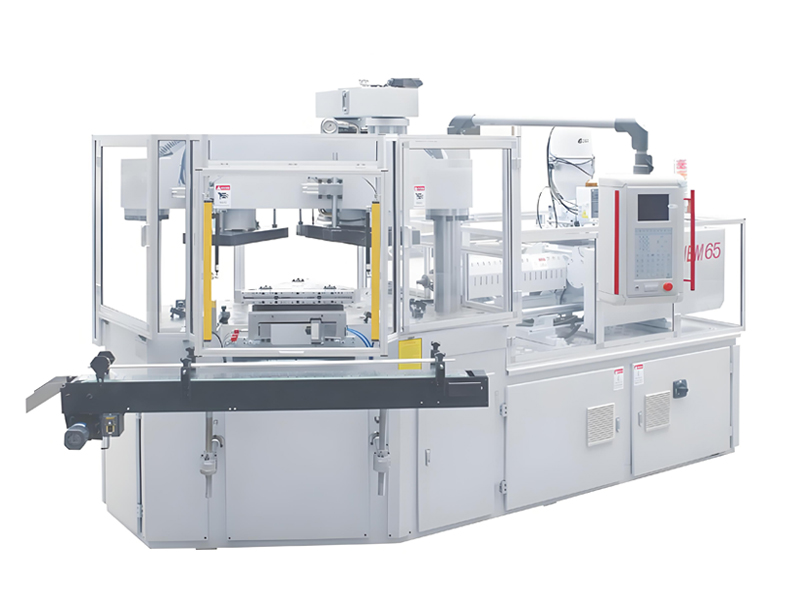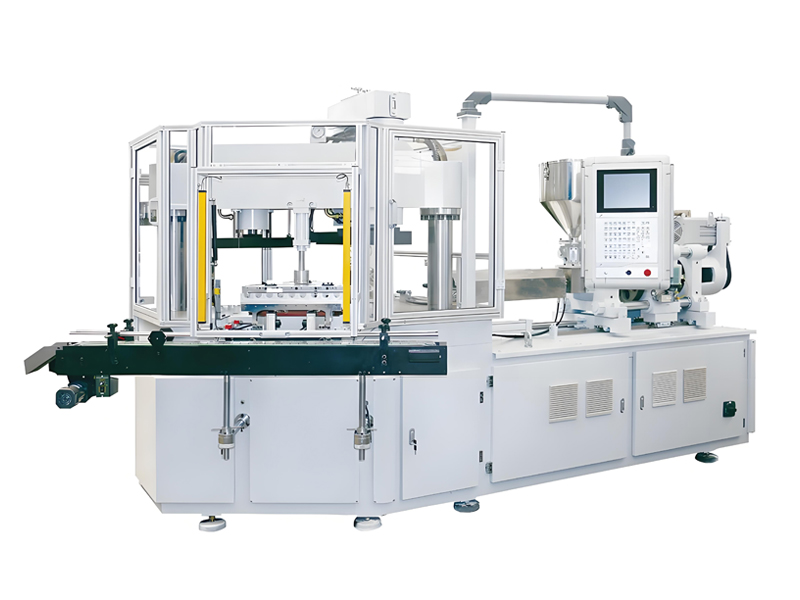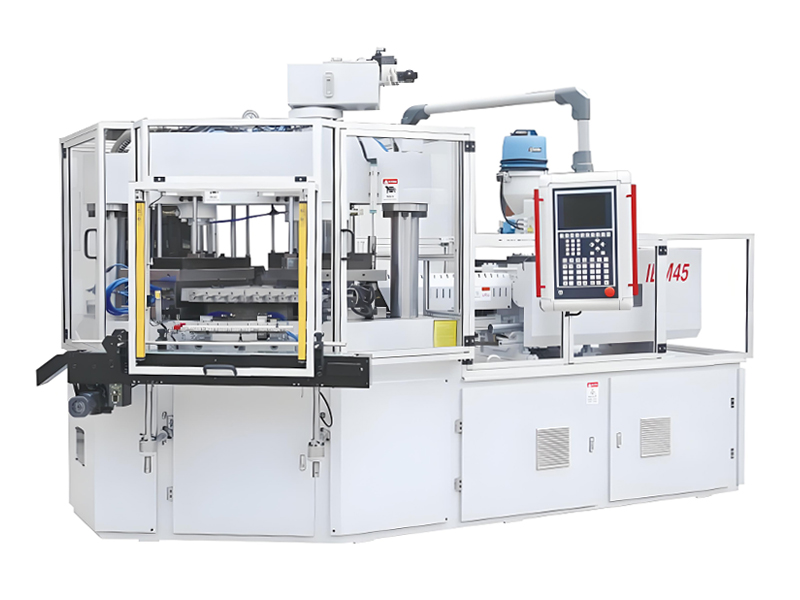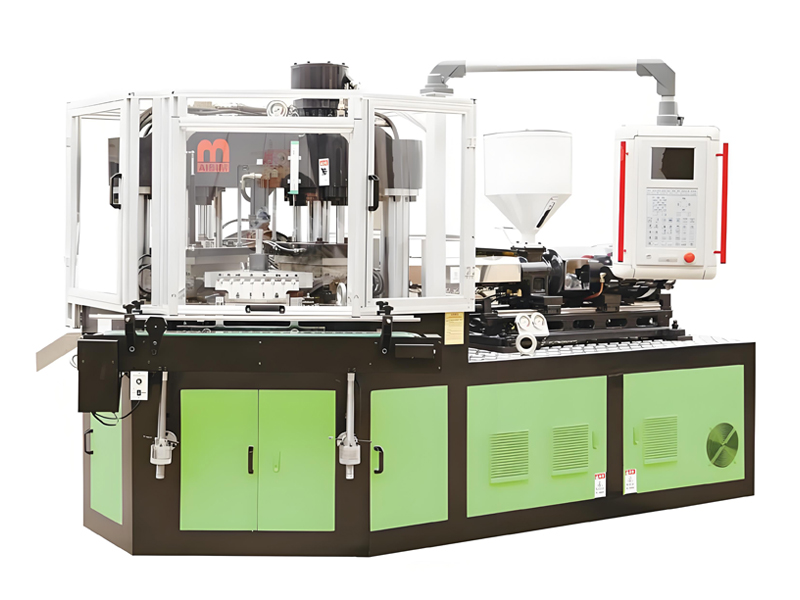
Per-bottle production cost is the metric that decides whether a pharmaceutical, cosmetic or oral-liquid bottle program is profitable, and on a multi-cavity injection blow molding machine that cost is governed less by the machine sticker than by the interaction of cavity count, cycle time, resin share, scrap rate and overall equipment effectiveness. An injection blow molding machine (IBM) builds small-volume containers in a single, integrated cycle by injecting a parison onto a core rod and then blowing it into the bottle shape, which removes flash, trimming and regrind from the cost equation. This article breaks the per-bottle cost model into measurable, physics-based drivers and shows how the same bottle produced on 4, 8 or 12 cavities changes its cost index without invoking any currency figure. Whether you run an Aibim IBM75, IBM65 or the IBM55 Hybrid Electric machine, the levers described here apply because they are rooted in the process, not the badge.
What Drives Per-Bottle Cost in Injection Blow Molding
Per-bottle cost is best understood as the sum of a material term and a conversion term, where the conversion term is everything the machine, the mold, the operator and the facility add on top of the resin. On a multi-cavity injection blow molding machine the material term scales almost linearly with bottle weight, while the conversion term is largely fixed per cycle and therefore divided among however many cavities are running. That single structural fact explains why cavity count is the dominant commercial lever for small bottles.
The five physical quantities that actually move per-bottle cost are clamping tonnage, cavity count, cycle time in seconds, shot weight in grams and energy expressed as kilowatt-hours per 1000 bottles. Secondary terms such as scrap rate percentage and OEE percentage act as multipliers that can erase the gains from a high cavity count if they are neglected. Labor, expressed as labor hours per shift, enters as a near-fixed cost that high cavitation helps dilute.
A useful mental model is that each cycle of the machine costs roughly the same in energy, labor attention and depreciation regardless of whether it makes 4 or 12 good bottles; the difference is simply how many saleable units that fixed cost is spread across. This is why the per-bottle cost index falls as cavities rise, provided quality holds. The remainder of this article quantifies each driver with typical values drawn from small-bottle production in the 3 ml to 1000 ml range that Aibim machines serve.
It is worth stating the boundary of the model up front: the figures below describe rigid, non-stretch IBM bottles in PP, PE, PS, PC and similar resins, plus stretch-blow (ISBM) grades for PET, produced on three-station machines. They are illustrative typical values intended for relative comparison, not a quotation, and actual numbers vary with bottle geometry, wall thickness, neck finish and local utility cost structure.
The Multi-Cavity Geometry: Cavity Count, Clamp Tonnage and Throughput
Cavity count is the primary scaling variable on a multi-cavity injection blow molding machine because it sets how many bottles are born in every machine cycle. But cavities cannot be increased in isolation; each added cavity raises the shot weight that must be injected and therefore pushes up the required clamping tonnage and the injection-unit capacity. The table below shows a typical mapping for small bottles in the 5 ml to 250 ml class, aligned to common Aibim machine classes.
Typical Cavity-to-Tonnage-to-Throughput Mapping
| Cavity count | Typical shot weight per cycle (g) | Required clamp tonnage (t) | Cycle time (s) | Bottles per hour | Indicative Aibim class |
|---|---|---|---|---|---|
| 4 | 28 to 34 | 55 to 75 | 11 to 13 | 1,100 to 1,300 | IBM55 Hybrid |
| 6 | 42 to 50 | 75 to 100 | 11 to 13 | 1,650 to 1,950 | IBM65 |
| 8 | 56 to 66 | 100 to 130 | 12 to 14 | 2,050 to 2,400 | IBM65 / IBM75 |
| 10 | 70 to 82 | 130 to 160 | 12 to 14 | 2,550 to 3,000 | IBM75 |
| 12 | 84 to 98 | 160 to 200 | 13 to 15 | 2,900 to 3,300 | IBM75 |
Two things stand out. First, cycle time barely moves as cavities increase from 4 to 12, because the parison injection, blow and ejection stages are largely parallel across cavities on a rotary or indexing turret; the machine makes 12 bottles in roughly the same wall-clock time it makes 4. Second, clamp tonnage climbs in step with shot weight, which is why a machine sized for 4 cavities cannot simply be re-molded to 12 without exceeding its clamp and injection capacity. Selecting the correct Aibim class up front protects the per-bottle cost target.
The throughput column is the commercial heart of the table. Going from 4 to 12 cavities roughly triples hourly output without tripling floor space, labor or depreciation, and that is the mechanism behind the cost-index drop discussed later. The hybrid-electric IBM55 is especially relevant here because its servo-driven clamp and injection can tighten cycle time at the low end of the cavity range.
Per-Bottle Cost Component Breakdown by Percentage
Before any currency is introduced, the cost structure of a small IBM bottle is best expressed as shares of the total per-bottle cost. These shares are stable across regions because they are driven by physics and process, not by local price levels. Resin dominates; everything else is the conversion premium you pay to turn pellets into a compliant bottle.
Typical Per-Bottle Cost Shares
| Cost component | Share of per-bottle cost | What moves it |
|---|---|---|
| Resin / polymer material | 55% to 70% | Bottle weight, wall thickness, grade, regrind policy |
| Energy (electricity) | 8% to 14% | kWh per 1000 bottles, cavity count, hybrid drive |
| Labor (per shift) | 6% to 12% | Labor hours per shift, automation, cavities |
| Machine depreciation / amortization | 6% to 11% | Acquisition tier, useful life, utilization |
| Mold & core-rod amortization | 3% to 7% | Cavity count, shot count, lead time |
| Scrap / yield loss | 2% to 6% | Scrap rate, OEE, material drying |
| Overhead (facility, QA, consumables) | 4% to 8% | Site cost, inspection regime, cleanroom class |
The dominant 55 percent to 70 percent resin share carries an important implication: for small bottles, the fastest route to lower per-bottle cost is rarely a cheaper machine, it is a lighter bottle and a tighter scrap rate. A 10 percent reduction in bottle weight cuts the largest cost block directly, whereas shaving the energy share from 12 percent to 9 percent only moves total cost by about 3 percent. Both matter, but the ranking is clear.
Energy at 8 percent to 14 percent is the second most actionable block, and it is where multi-cavity design and hybrid-electric drives pay back. Aibim cites a minimum 35 percent energy saving on its IBM platforms through PREFILL technology and variable-displacement pump pressurization in the hydraulic system, which compresses the energy share without touching the resin share. Labor at 6 percent to 12 percent is diluted by higher cavitation because one operator oversees a machine that now makes three times the bottles per hour.
Cycle Time Anatomy and Its Cost Leverage
Cycle time in seconds is the denominator of every throughput calculation, and on a three-station IBM machine it is built from injection, cooling, indexing, blow and ejection stages that overlap across the turret. Understanding the anatomy lets you target the right stage when cost needs compressing, rather than guessing.
Typical Stage Durations Within One Cycle
| Stage | Typical duration (s) | Cost lever |
|---|---|---|
| Injection of parison onto core rod | 2.5 to 4.0 | Injection speed, screw design, melt homogeneity |
| Cooling of parison on core rod | 4.0 to 6.0 | Core-rod cooling circuit, mold temp control |
| Index / transfer to blow station | 0.8 to 1.5 | Turret indexing precision, servo control |
| Blow & cooling of bottle | 3.0 to 5.0 | Blow pressure, bottle wall, neck calibration |
| Index to ejection station | 0.8 to 1.5 | Same as transfer |
| Ejection / stripping | 1.5 to 2.5 | Stripper station, laser safety sensor |
| Non-overlapping overhead | 1.0 to 2.0 | PLC sequencing, clamp open/close |
Total cycle time therefore lands near 13 seconds to 17 seconds for a representative small bottle. Because all cavities advance together on the turret, adding cavities does not add proportional seconds; instead the fixed overhead is divided among more bottles. The cooling stages are usually the longest and the most sensitive to core-rod temperature control, which is why the next sections treat thermal management as a cost control in its own right.
A practical targeting rule: if your cycle is dominated by parison cooling, invest in core-rod circuit optimization and a tighter mold-temperature band before adding cavities; if it is dominated by blow cooling, revisit bottle wall distribution and blow-air recovery. Chasing cavitation while the cycle is thermally limited simply spreads a slow cycle across more cavities and leaves per-bottle cost unchanged.
Energy Intensity: kWh per 1000 Bottles by Cavity Tier
Energy should always be compared as kilowatt-hours per 1000 bottles, not per machine, because that metric normalizes against output and reveals the real efficiency story. Higher cavity counts raise total installed power slightly, but they slash energy per bottle because the fixed thermal and hydraulic overhead is amortized across more units.
Energy per 1000 Bottles by Cavity Tier
| Cavity count | kWh per 1000 bottles (hydraulic) | kWh per 1000 bottles (hybrid-electric) | Energy share movement |
|---|---|---|---|
| 4 | 3.0 to 3.4 | 2.0 to 2.3 | Highest per-bottle |
| 6 | 2.4 to 2.8 | 1.6 to 1.9 | Falls |
| 8 | 2.0 to 2.3 | 1.3 to 1.6 | Falls |
| 10 | 1.7 to 2.0 | 1.1 to 1.4 | Lower |
| 12 | 1.5 to 1.8 | 1.0 to 1.2 | Lowest per-bottle |
The hybrid-electric column is the reason Aibim positions the IBM55 Hybrid as a cost-control machine: by replacing the fixed-speed hydraulic pump with servo-driven clamp and injection, the idle and part-load energy falls, pushing the energy share toward the low end of the 8 percent to 14 percent band. On a 12-cavity hybrid line the energy per 1000 bottles can approach 1.0 kWh, roughly a 40 percent reduction versus a 4-cavity hydraulic baseline of the same bottle.
Two cautions. First, energy per bottle only improves if the line actually runs near its rated cadence; stoppages convert saved energy into idle draw and recover nothing. Second, compressed-air and chilled-water auxiliaries are often omitted from machine nameplate figures, so a full audit should include the chiller and air receiver that feed the blow and cooling stations. Treating the machine in isolation understates the true energy share.
Material Selection and Processing Windows
Material choice sets both the resin share (through density and required wall) and the scrap tendency. The processing window of each resin determines how forgiving the multi-cavity run will be; a narrow window raises the scrap rate and therefore the per-bottle cost even when the resin itself is cheap.
Processing Windows for Common IBM Resins
| Material | Drying requirement | Melt temp (°C) | Mold / core-rod temp (°C) | Density (g/cm³) | Scrap tendency |
|---|---|---|---|---|---|
| PP | Low / usually none | 200 to 280 | 20 to 60 | 0.90 to 0.91 | Low |
| HDPE / PE | Low / usually none | 180 to 280 | 20 to 60 | 0.94 to 0.97 | Low |
| PS | Low | 180 to 280 | 20 to 70 | 1.04 to 1.06 | Medium (brittle) |
| PC | Yes, ~120 °C / 4 h | 280 to 320 | 80 to 120 | 1.20 | Medium (moisture sensitive) |
| PET (ISBM) | Yes, ~160 °C | 265 to 290 | 10 to 40 | 1.38 | Medium (needs stretch) |
Polypropylene is the workhorse for pharmaceutical, cosmetic and oral-liquid bottles because its wide melt window and low moisture sensitivity keep the scrap rate low and the process stable across a 12-cavity mold. Polyethylene behaves similarly and is favored for squeeze and opaque containers. Polystyrene delivers clarity for cosmetic jars but is brittle and demands careful ejection to avoid stress cracks, nudging scrap tendency to medium.
Polycarbonate brings high heat resistance and optical clarity but requires strict drying and an elevated mold or core-rod temperature band of 80 °C to 120 °C; skip the dryer and the scrap rate climbs through silver streaks and hydrolytic degradation. PET is handled on the stretch-blow (ISBM) configuration of an injection (stretch) blow machine, where a biaxial stretch step lifts clarity and barrier; it too demands aggressive drying or the per-bottle cost inflation from scrap and rejected batches is severe.
For regulated packs, the material must also clear the compliance bar: food and pharma contact grades referenced to FDA 21 CFR, EU 10/2011, USP Class VI and, for primary pharma packaging, ISO 15378 under a GMP framework. Choosing a compliant grade up front avoids the far larger hidden cost of a failed audit or a recalled lot.
Scrap Rate, OEE and Yield Loss
Scrap rate and OEE are the multipliers that decide whether the cavity-count gains survive contact with the factory floor. A 12-cavity line that runs at a poor OEE can cost more per bottle than an 8-cavity line running cleanly, because the fixed conversion cost is divided across fewer saleable units than the cavity count implies.
Typical and Best-in-Class Operational Metrics
| Metric | Typical used range | Best-in-class |
|---|---|---|
| Scrap rate | 2% to 6% | Below 1.5% |
| OEE (overall equipment effectiveness) | 60% to 75% | Above 85% |
| Availability | 85% to 92% | Above 95% |
| Performance (speed) | 90% to 96% | Above 98% |
| Quality yield | 97% to 99% | Above 99.5% |
OEE is the product of availability, performance and quality, so a line at 90 percent availability, 94 percent performance and 98 percent quality sits near 83 percent OEE; drop any one leg and the index falls fast. For cost modeling, treat OEE as the real divisor on cavity throughput: a 12-cavity line rated at 3,200 bottles per hour only delivers 3,200 times OEE in practice. At 70 percent OEE that is 2,240 effective bottles per hour, barely ahead of an 8-cavity line at 85 percent OEE.
Scrap rate feeds the cost model directly through the 2 percent to 6 percent scrap block, but its true cost is larger because every scrapped bottle also consumed the energy and labor share that produced it. Closing the scrap rate from 5 percent to 1.5 percent therefore recovers not just resin but the full conversion premium on those units, which is why drying discipline for PC and PET and core-rod cooling stability for PS pay back so strongly.
Mold and Core-Rod Temperature Control
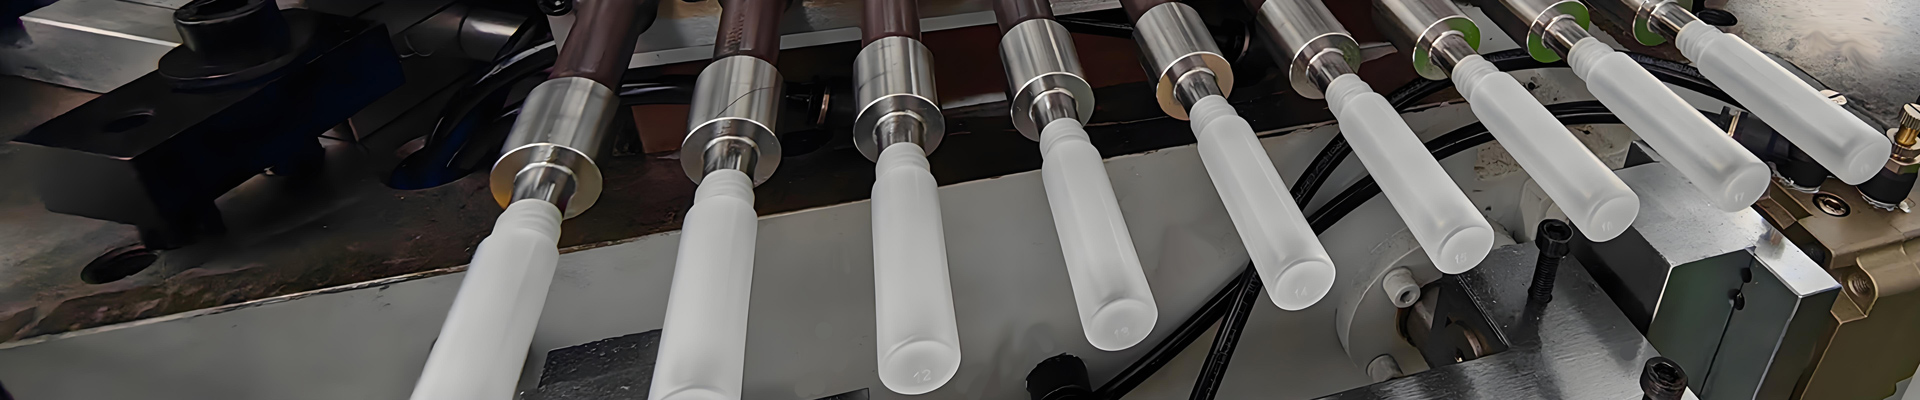
The core rod is the defining element of IBM: it carries the injected parison from the injection station to the blow station and defines the bottle interior, neck and thread. Its temperature profile controls parison set, wall distribution and ejection quality, so core-rod cooling is a first-order cost lever rather than a footnote.
An unstable core-rod temperature band produces bottles with variable wall thickness, neck deformation and sticking at ejection, all of which raise scrap rate. Tight control, typically within a few degrees of setpoint, lets the parison cool just enough to hold shape yet stay warm enough to blow cleanly, shortening the cooling stage and trimming cycle time. This is the same lever that the cycle-time table flagged as the longest stage.
Mold-temperature control on the blow cavity governs surface finish and dimensional repeatability. For materials like PC the mold or core-rod band of 80 °C to 120 °C must be held steadily; for PP and PE a 20 °C to 60 °C band suffices. Investing in a closed-loop chiller and individually monitored core-rod circuits is a modest capital add that protects the scrap-rate and OEE terms, and therefore the per-bottle cost, far more reliably than chasing a higher cavity count on a thermally unstable tool.
Aibim’s machine structure supports this with an enlarged mold-setting space and a single-crossbeam, double-pole clamping framework that holds the tool square under repeated cycling, reducing the micro-shifts that drift wall thickness and push scrap upward. Combined with SD-card parameter storage, a proven thermal recipe can be reloaded identically across machines, which stabilizes the cost model when capacity is added later.
The Three-Station One-Step Process and the No-Flash Advantage
The three-station, one-step architecture is what makes IBM structurally cheaper than processes that need a separate parison-making or trimming step. In station one the parison is injected onto the core rod; in station two it is blown into the bottle; in station three it is stripped and ejected. The core rod indexes between stations on a turret, so there is no intermediate handling, no post-mold flash and no deflashing operation.
No flash means no regrind stream and no trimming labor, which removes two cost blocks that other blow processes carry: the labor and energy of deflashing, and the yield loss and quality risk of reprocessing scrap. It also yields a bottle with a finished neck and thread straight from the mold, meeting the cosmetic and pharmaceutical requirement for a clean, burr-free finish without a secondary operation.
Aibim reinforces this with PREFILL technology and a variable-displacement pump pressurization in the hydraulic system, which cuts energy consumption by a minimum of 35 percent versus conventional fixed-pump hydraulics, and with CE-certified safety on the stripper station via a long-distance digital laser sensor and a light curtain. The energy reduction flows straight into the 8 percent to 14 percent energy share, and the clean ejection flows into the scrap-rate term, so both cost blocks improve simultaneously.
For buyers, the commercial reading is simple: the no-flash, one-step design converts directly into a lower conversion premium per bottle and a smaller overhead block, which is why IBM is the default choice for high-volume small pharma, cosmetic and oral-liquid containers where finish quality and cost per unit are both non-negotiable.
Cost Scaling from 4 to 12 Cavities: Dimensionless Ratios
The cleanest way to express the cavity-count benefit without currency is a per-bottle cost index, normalized so that a 4-cavity baseline equals 100. This index bundles the diluted conversion premium, the lower energy per bottle and the amortized tooling, while holding bottle weight and material constant. It deliberately excludes resin, which is invariant with cavities for the same bottle.
Per-Bottle Cost Index by Cavity Count (4-cavity baseline = 100)
| Cavity count | Conversion cost index | Relative drop vs 4-cavity | Energy per 1000 bottles (hybrid) |
|---|---|---|---|
| 4 | 100 | Baseline | 2.0 to 2.3 kWh |
| 6 | 78 to 82 | ~18% to 22% lower | 1.6 to 1.9 kWh |
| 8 | 64 to 68 | ~32% to 36% lower | 1.3 to 1.6 kWh |
| 10 | 56 to 60 | ~40% to 44% lower | 1.1 to 1.4 kWh |
| 12 | 52 to 56 | ~44% to 48% lower | 1.0 to 1.2 kWh |
The headline conclusion is straightforward: the per-bottle cost index drops roughly 35 percent when moving from 4 cavities to 12 cavities, and closer to 45 percent at the high end of the range, assuming the line holds a good OEE and a low scrap rate. Stated another way, tripling cavities more than halves the conversion premium per bottle.
The index is a ratio, not a price, so it travels across regions and currencies. A buyer in any market can take their own 4-cavity baseline cost and apply the index to estimate the 12-cavity outcome. The only assumptions are that bottle weight, material grade and scrap discipline stay constant; if scrap rate rises with cavitation because the tool or thermal control was not upgraded, the index will not be reached and the expected saving evaporates.
This is why Aibim sizes the machine class to the cavity target rather than promising cavitation on an undersized clamp. An IBM75 with 160 to 200 tonnes of clamp supports 10 to 12 cavities cleanly, while forcing 12 cavities onto a 75-tonne frame would starve the injection and overstress the clamp, inflating scrap and undoing the index advantage.
IBM vs EBM vs ISBM on Per-Bottle Cost for Small Bottles
For small bottles in the 3 ml to 1000 ml range, three processes compete: injection blow molding (IBM), extrusion blow molding (EBM) and injection stretch blow molding (ISBM). Their per-bottle cost profiles differ because of flash, wall control and finish quality.
Process Comparison on Small-Bottle Cost Drivers
| Factor | IBM (Aibim) | EBM | ISBM |
|---|---|---|---|
| Flash / scrap | None (no-flash) | Flash, needs deflash | Minimal |
| Neck / thread finish | Excellent, molded | Good, may need trim | Excellent |
| Wall uniformity | Very good | Variable | Excellent |
| Material range | PP, PE, PS, PC, ABS, SAN | PE, PP, PVC, others | PET, PP, PS |
| Best bottle size | 3 ml to 1000 ml | Larger, >100 ml | Water, CSB, <1000 ml |
| Conversion cost index | Low at high cavity | Medium | Low, PET-optimized |
For small pharma and cosmetic bottles, IBM wins on finish quality and no-flash economy, while ISBM wins where PET clarity and barrier are required and the volume justifies the stretch step. EBM is stronger for larger industrial containers where flash handling is less penalizing. The practical guidance is to match process to bottle size and material first, then maximize cavities within that process to capture the index drop described above.
Aibim, a Wanplas factory, specializes in exactly this IBM and I(S)BM sweet spot, with the IBM75, IBM65 and IBM55 Hybrid covering the 3 ml to 1000 ml range and the cavity counts that deliver the lowest conversion index. As part of the Wanplas brand network, Aibim applies the group’s shared quality and service standards, including an annual complimentary spare-parts package and on-site commissioning support, which further stabilizes the operating-cost side of the per-bottle model.
Frequently Asked Questions
What is the single largest component of per-bottle cost on an injection blow molding machine?
Resin or polymer material is normally the largest single component, typically accounting for 55 percent to 70 percent of per-bottle cost for small pharmaceutical, cosmetic and oral-liquid bottles, before any conversion or overhead is added.
How much does per-bottle cost drop when moving from 4 cavities to 12 cavities?
On a like-for-like bottle and material, the per-bottle cost index drops roughly 35 percent to 45 percent when moving from a 4-cavity configuration to a 12-cavity configuration, because fixed conversion cost is spread across three times the output per cycle while energy per 1000 bottles falls.
Which material gives the lowest scrap rate for multi-cavity IBM?
Polypropylene and polyethylene typically give the lowest scrap tendency in IBM because they do not require aggressive drying and tolerate a wide processing window, whereas polycarbonate and PET demand strict drying and tighter temperature control to stay below a 2 percent scrap rate.
Why does the three-station one-step IBM process reduce cost?
Because the parison is injected directly onto the core rod and blown in the same machine with no transfer handling, IBM produces bottles with no flash and no regrind scrap, eliminating the trimming, deflashing and scrap-reprocessing steps that add labor, energy and yield loss in other processes.
How is energy consumption best expressed for cost comparison?
The most comparable metric is kilowatt-hours per 1000 bottles rather than per machine, because it normalizes energy against output and reveals that higher cavity counts lower energy per bottle even when total installed power is higher.
Does a higher cavity count always lower per-bottle cost?
Not automatically. The benefit only materializes if the machine sustains a high OEE and low scrap rate; a 12-cavity mold running at 65 percent OEE with a 5 percent scrap rate can cost more per bottle than an 8-cavity mold running cleanly above 85 percent OEE.
What compliance standards apply to pharma and cosmetic IBM bottles?
Primary pharmaceutical packaging is evaluated under GMP and ISO 15378, with material contact assessed against USP Class VI, FDA 21 CFR and EU 10/2011 depending on the market; cosmetic packs follow the relevant food- and skin-contact provisions of the same frameworks.
Which Aibim machine class fits a 10 to 12 cavity program?
The IBM75, with a clamp band of roughly 160 to 200 tonnes and an injection capacity matched to an 84 to 98 gram shot, is the class sized for 10 to 12 cavities, while the IBM65 covers the 6 to 8 cavity range and the IBM55 Hybrid serves 4 to 6 cavities with the lowest energy per bottle.
Conclusion
Per-bottle production cost on a multi-cavity injection blow molding machine is governed by a small set of measurable drivers: cavity count, cycle time, resin share, energy per 1000 bottles, scrap rate and OEE. Resin dominates at 55 percent to 70 percent, so the fastest saving is a lighter bottle and tighter scrap, while the conversion premium is compressed most effectively by raising cavities on a properly sized, thermally stable machine. The per-bottle cost index drops roughly 35 percent to 45 percent from 4 to 12 cavities when OEE and scrap discipline hold, and the three-station no-flash process removes deflashing and regrind entirely. For small pharma, cosmetic and oral-liquid bottles, Aibim, a Wanplas factory, delivers this economy through the IBM75, IBM65 and IBM55 Hybrid with PREFILL energy-saving hydraulics and CE-certified safety, making multi-cavity IBM the structurally lowest-cost route to a flawless, compliant small bottle.